Multi-resolution Spatial Graphical Regression Models for Hierarchical Spatial Transcriptomics Data
Publication
Metrics
AI Quick Summary
The authors develop a Bayesian multi-resolution spatial graphical regression (mSGR) framework to infer gene networks that vary across hierarchical spatial regions in tumor tissues, capturing local and global organization. Using spatial priors and a scalable variational Bayes algorithm, mSGR improves edge detection and identifies hub genes along tumor gradients, demonstrated on kidney cancer data with stronger regulatory connectivity in transitional regions.
Paper Preview
Abstract
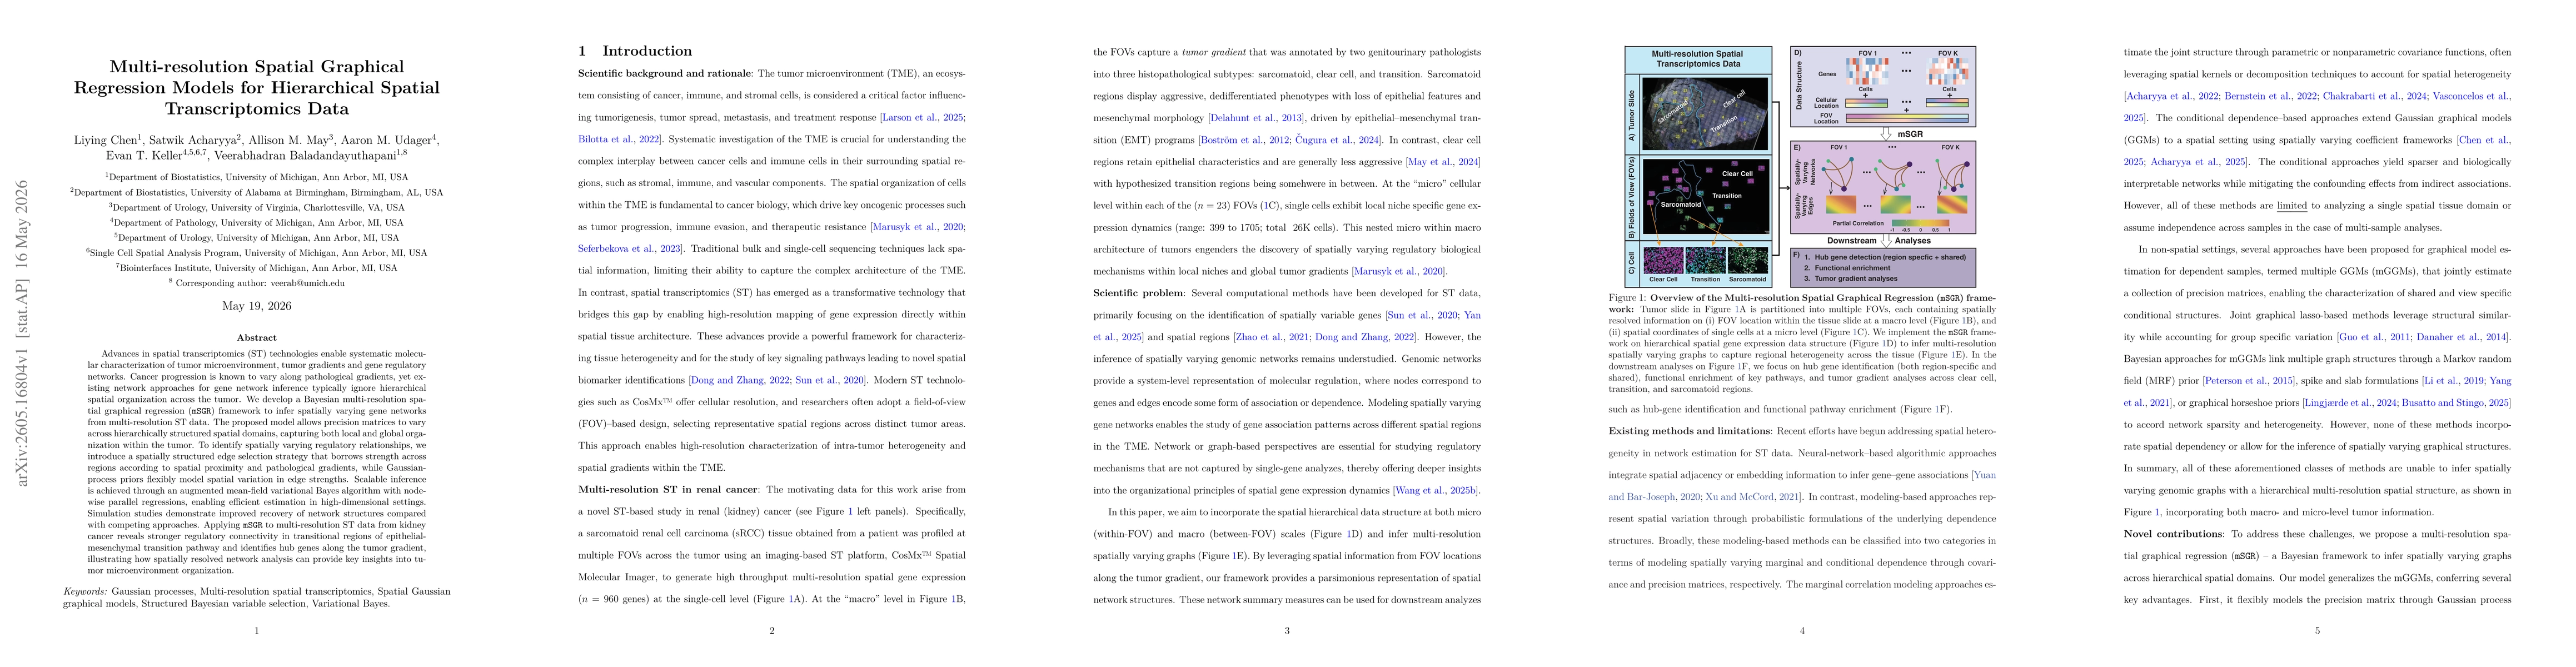
Advances in spatial transcriptomics (ST) technologies enable systematic molecular characterization of tumor microenvironment, tumor gradients and gene regulatory networks. Cancer progression is known to vary along pathological gradients, yet existing network approaches for gene network inference typically ignore hierarchical spatial organization across the tumor. We develop a Bayesian multi-resolution spatial graphical regression (mSGR) framework to infer spatially varying gene networks from multi-resolution ST data. The proposed model allows precision matrices to vary across hierarchically structured spatial domains, capturing both local and global organization within the tumor. To identify spatially varying regulatory relationships, we introduce a spatially structured edge selection strategy that borrows strength across regions according to spatial proximity and pathological gradients, while Gaussian-process priors flexibly model spatial variation in edge strengths. Scalable inference is achieved through an augmented mean-field variational Bayes algorithm with node-wise parallel regressions, enabling efficient estimation in high-dimensional settings. Simulation studies demonstrate improved recovery of network structures compared with competing approaches. Applying mSGR to multi-resolution ST data from kidney cancer reveals stronger regulatory connectivity in transitional regions of epithelial-mesenchymal transition pathway and identifies hub genes along the tumor gradient, illustrating how spatially resolved network analysis can provide key insights into tumor microenvironment organization.
AI Key Findings
Get AI-generated insights about this paper's methodology, results, significance, and more — seven facets brought into focus.
Discussion 0