Publication
Metrics
AI Quick Summary
This research applies a novel tensor-driven SIR model to US Google search data for RSV and WNV, revealing spatial structure of disease spread. Human movement and demographics explain transmission rates, with subsequent season patterns predictable using prior season parameters and recent data.
Paper Preview
Abstract
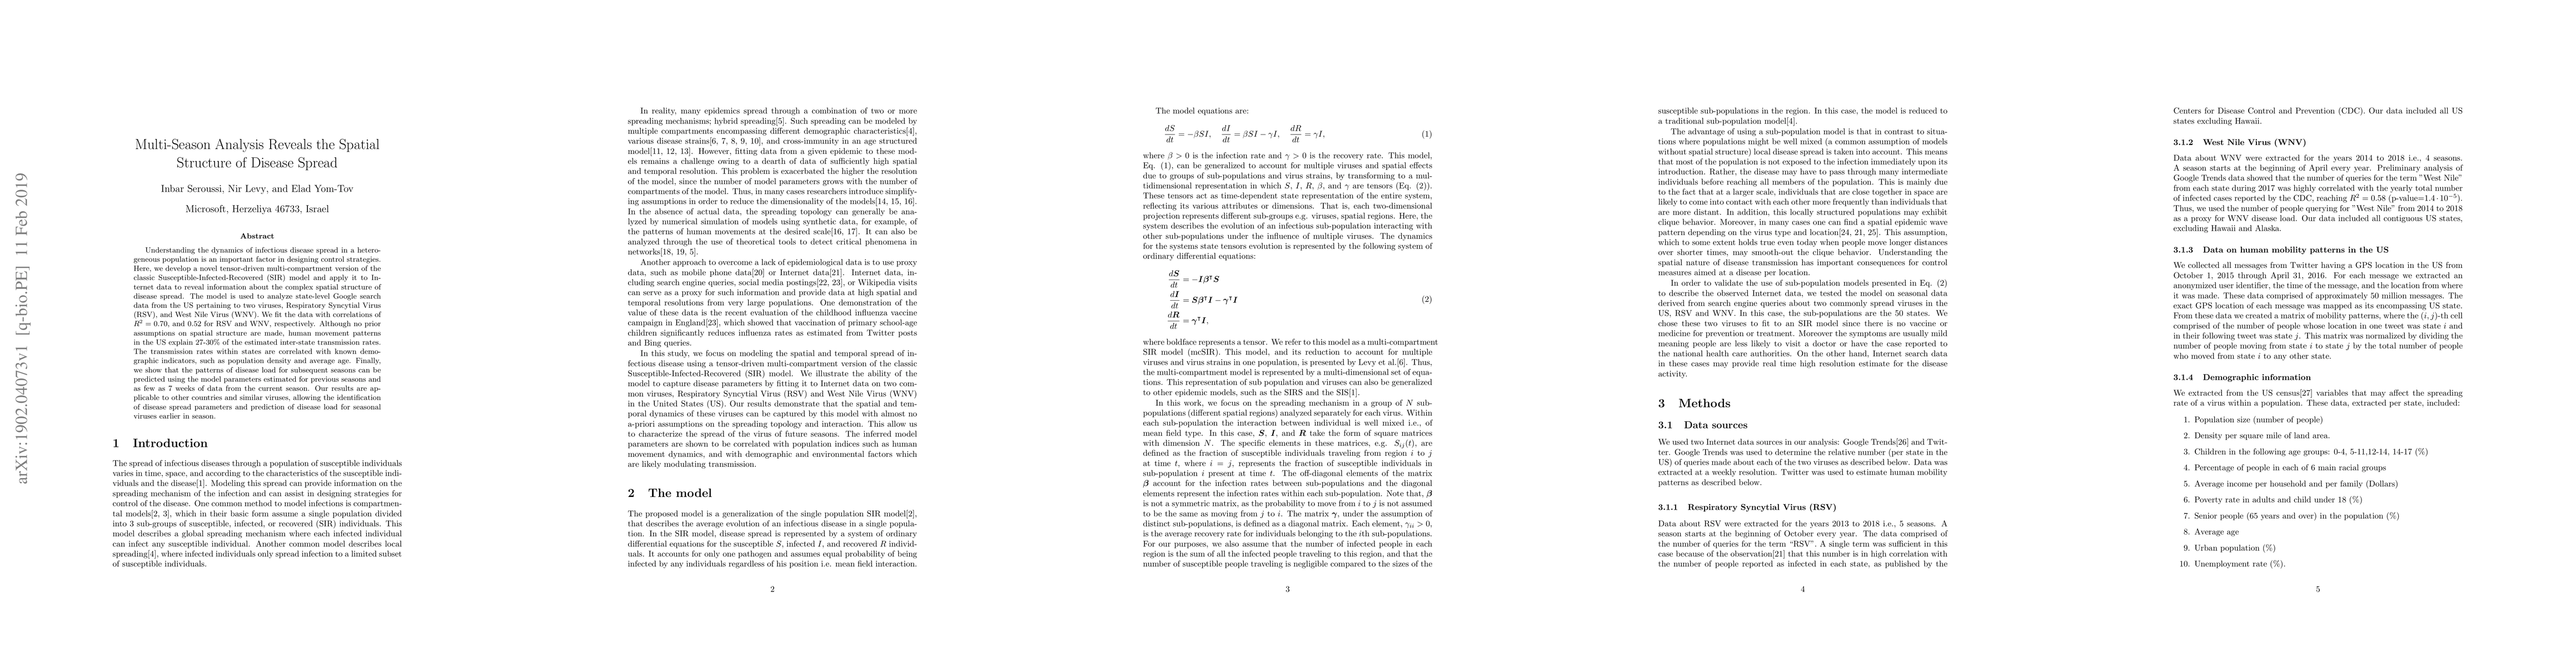
Understanding the dynamics of infectious disease spread in a heterogeneous population is an important factor in designing control strategies. Here, we develop a novel tensor-driven multi-compartment version of the classic Susceptible-Infected-Recovered (SIR) model and apply it to Internet data to reveal information about the complex spatial structure of disease spread. The model is used to analyze state-level Google search data from the US pertaining to two viruses, Respiratory Syncytial Virus (RSV), and West Nile Virus (WNV). We fit the data with correlations of $R^2=0.70$, and $0.52$ for RSV and WNV, respectively. Although no prior assumptions on spatial structure are made, human movement patterns in the US explain 27-30\% of the estimated inter-state transmission rates. The transmission rates within states are correlated with known demographic indicators, such as population density and average age. Finally, we show that the patterns of disease load for subsequent seasons can be predicted using the model parameters estimated for previous seasons and as few as $7$ weeks of data from the current season. Our results are applicable to other countries and similar viruses, allowing the identification of disease spread parameters and prediction of disease load for seasonal viruses earlier in season.
AI Key Findings
Get AI-generated insights about this paper's methodology, results, significance, and more — seven facets brought into focus.
Impact
Paper Details
Authors
PDF Preview
Key Terms
Citation Network
Current paper (gray), citations (green), references (blue)
Display is limited for performance on very large graphs.
Discussion 0