Publication
Metrics
AI Quick Summary
This study analyzes 12 years of Fermi-LAT data for the FSRQ 4C+28.07, identifying three distinct flaring states and employing a Log-parabola model for gamma-ray spectral analysis. A two-zone leptonic model is used to fit the multi-wavelength data, revealing significant time delays between radio and gamma-ray emissions, suggesting separate emission zones.
Paper Preview
Abstract
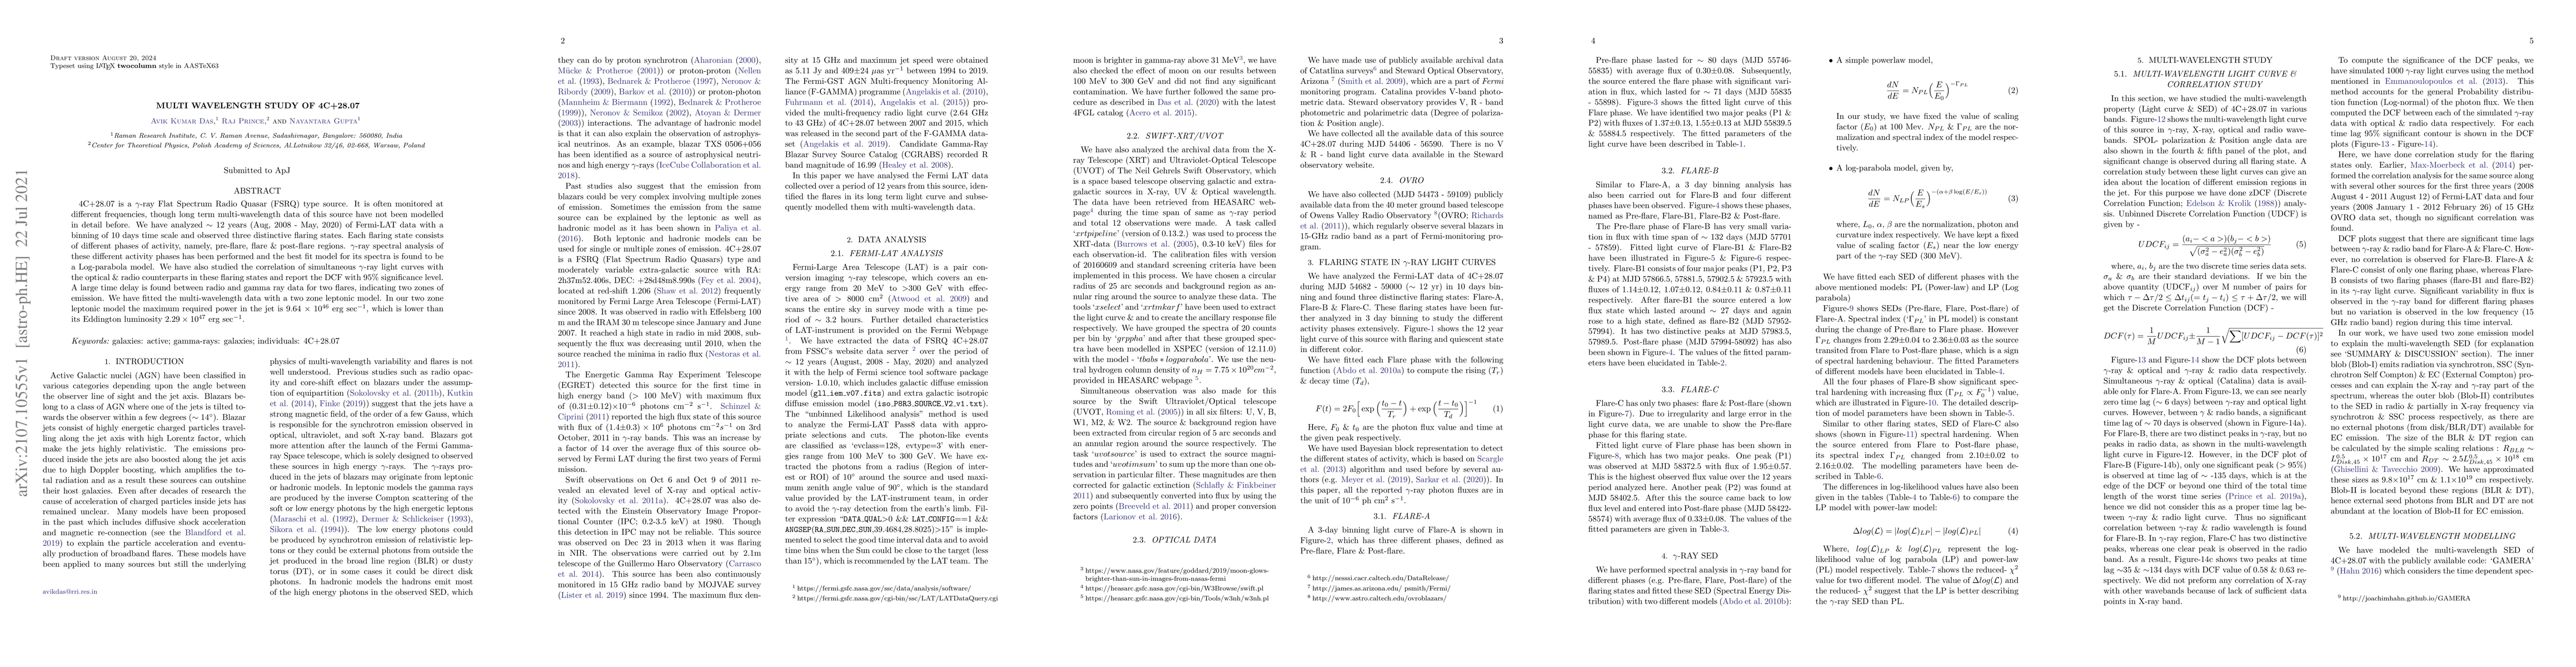
4C+28.07 is a $\gamma$-ray Flat Spectrum Radio Quasar (FSRQ) type source. It is often monitored at different frequencies, though long-term multi-wavelength data of this source have not been modelled in detail before. We have analyzed $\sim 12$ years (Aug, 2008 - May, 2020) of Fermi-LAT data with a binning of 10 days time scale and observed three distinctive flaring states. Each flaring state consists of different phases of activity, namely, pre-flare, flare \& post-flare regions. $\gamma$-ray spectral analysis of these different activity phases has been performed and the best fit model for its spectra is found to be a Log-parabola model. We have also studied the correlation of simultaneous $\gamma$-ray light curves with the optical \& radio counterparts in these flaring states and report the DCF with a 95\% significance level. A large time delay is found between radio and gamma-ray data for two flares, indicating two zones of emission. We have fitted the multi-wavelength data with a two-zone leptonic model. In our two-zone leptonic model, the maximum required power in the jet is 9.64 $\times$ 10$^{46}$ erg sec$^{-1}$, which is lower than its Eddington luminosity $2.29\times 10^{47}$ erg sec$^{-1}$.
AI Key Findings
Get AI-generated insights about this paper's methodology, results, significance, and more — seven facets brought into focus.
Impact
Paper Details
Authors
PDF Preview
Key Terms
Citation Network
Current paper (gray), citations (green), references (blue)
Display is limited for performance on very large graphs.
Discussion 0