Authors
Summary
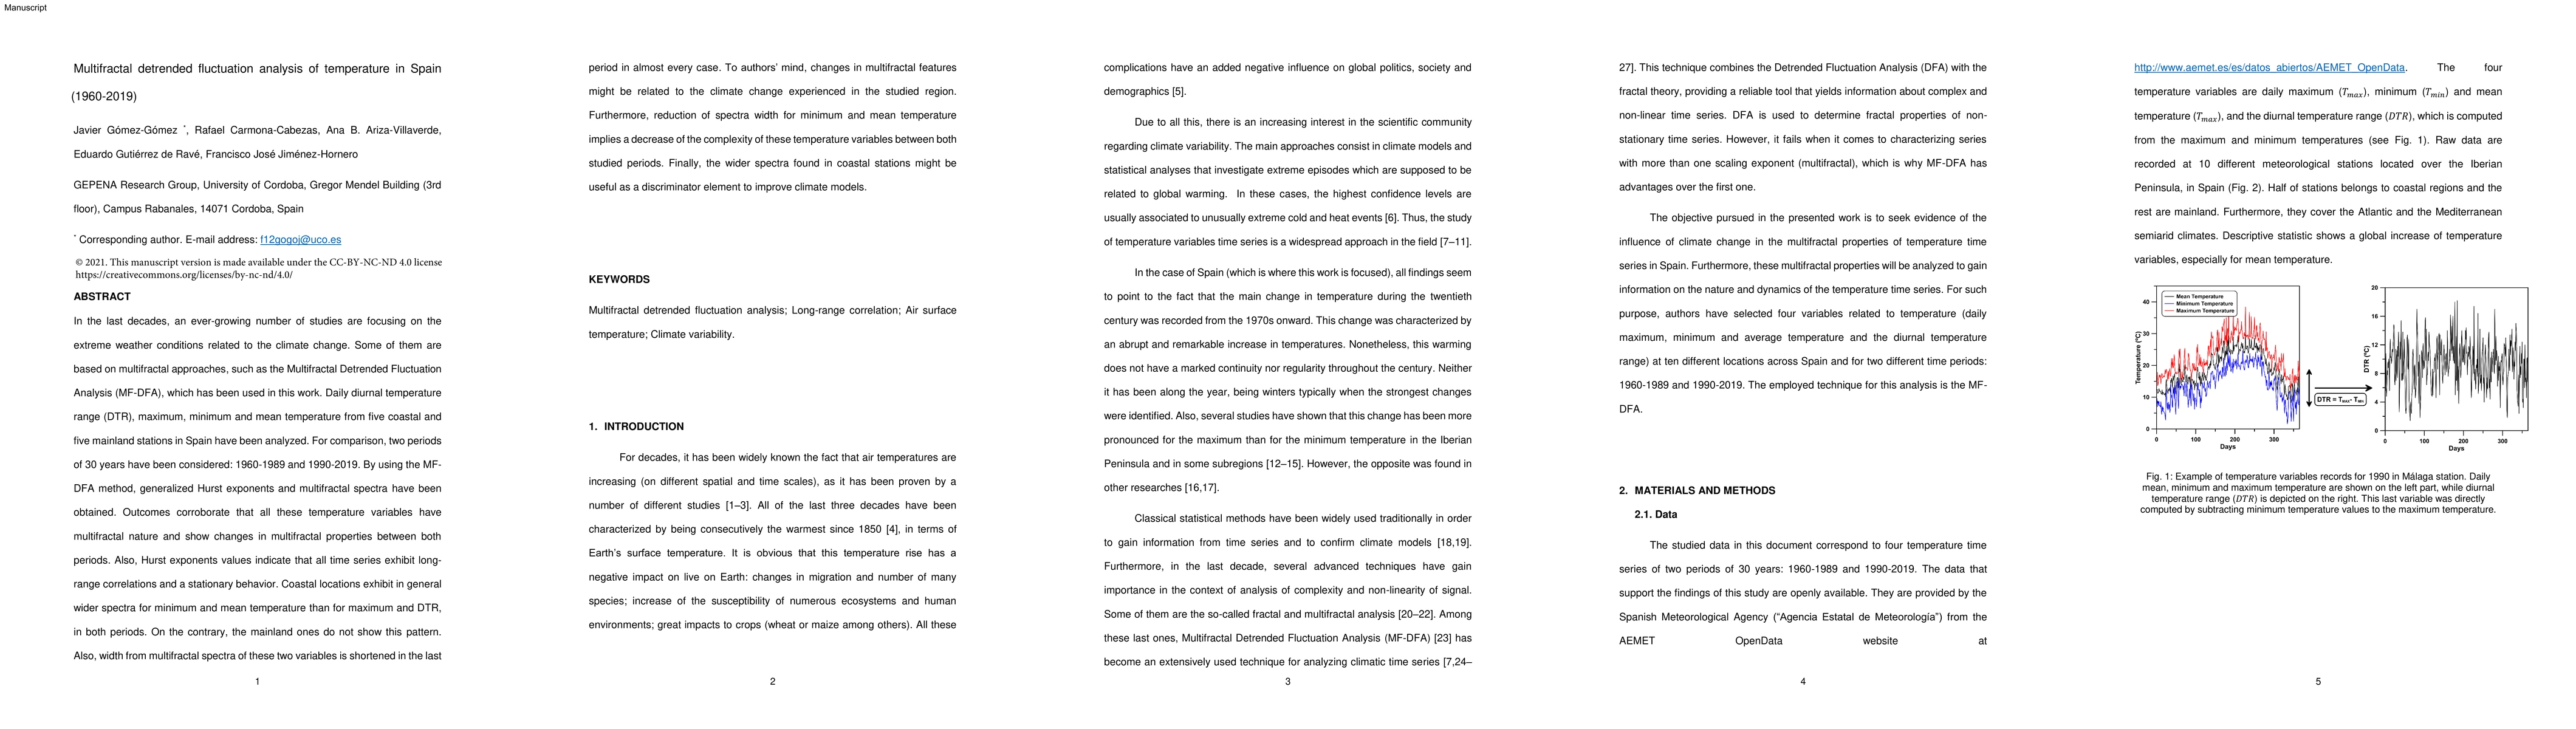
In the last decades, an ever-growing number of studies are focusing on the extreme weather conditions related to the climate change. Some of them are based on multifractal approaches, such as the Multifractal Detrended Fluctuation Analysis (MF-DFA), which has been used in this work. Daily diurnal temperature range (DTR), maximum, minimum and mean temperature from five coastal and five mainland stations in Spain have been analyzed. For comparison, two periods of 30 years have been considered: 1960-1989 and 1990-2019. By using the MF-DFA method, generalized Hurst exponents and multifractal spectra have been obtained. Outcomes corroborate that all these temperature variables have multifractal nature and show changes in multifractal properties between both periods. Also, Hurst exponents values indicate that all time series exhibit long-range correlations and a stationary behavior. Coastal locations exhibit in general wider spectra for minimum and mean temperature than for maximum and DTR, in both periods. On the contrary, the mainland ones do not show this pattern. Also, width from multifractal spectra of these two variables (minimum and mean temperature) is shortened in the last period in almost every case. To authors' mind, changes in multifractal features might be related to the climate change experienced in the studied region. Furthermore, reduction of spectra width for minimum and mean temperature implies a decrease of the complexity of these temperature variables between both studied periods. Finally, the wider spectra found in coastal stations might be useful as a discriminator element to improve climate models.
AI Key Findings
Get AI-generated insights about this paper's methodology, results, and significance.
Paper Details
PDF Preview
Key Terms
Citation Network
Current paper (gray), citations (green), references (blue)
Display is limited for performance on very large graphs.
Similar Papers
Found 4 papers| Title | Authors | Year | Actions |
|---|
Comments (0)