Multifractal wavelet dynamic mode decomposition modeling for marketing time series
Publication
Metrics
AI Quick Summary
This research combines dynamic mode decomposition with wavelet analysis to model and forecast marketing time series data, specifically focusing on brand sales and prices for Saudi brands from November 2017 to December 2021, aiming to understand the time scale effects on brand persistence and market competition.
Paper Preview
Abstract
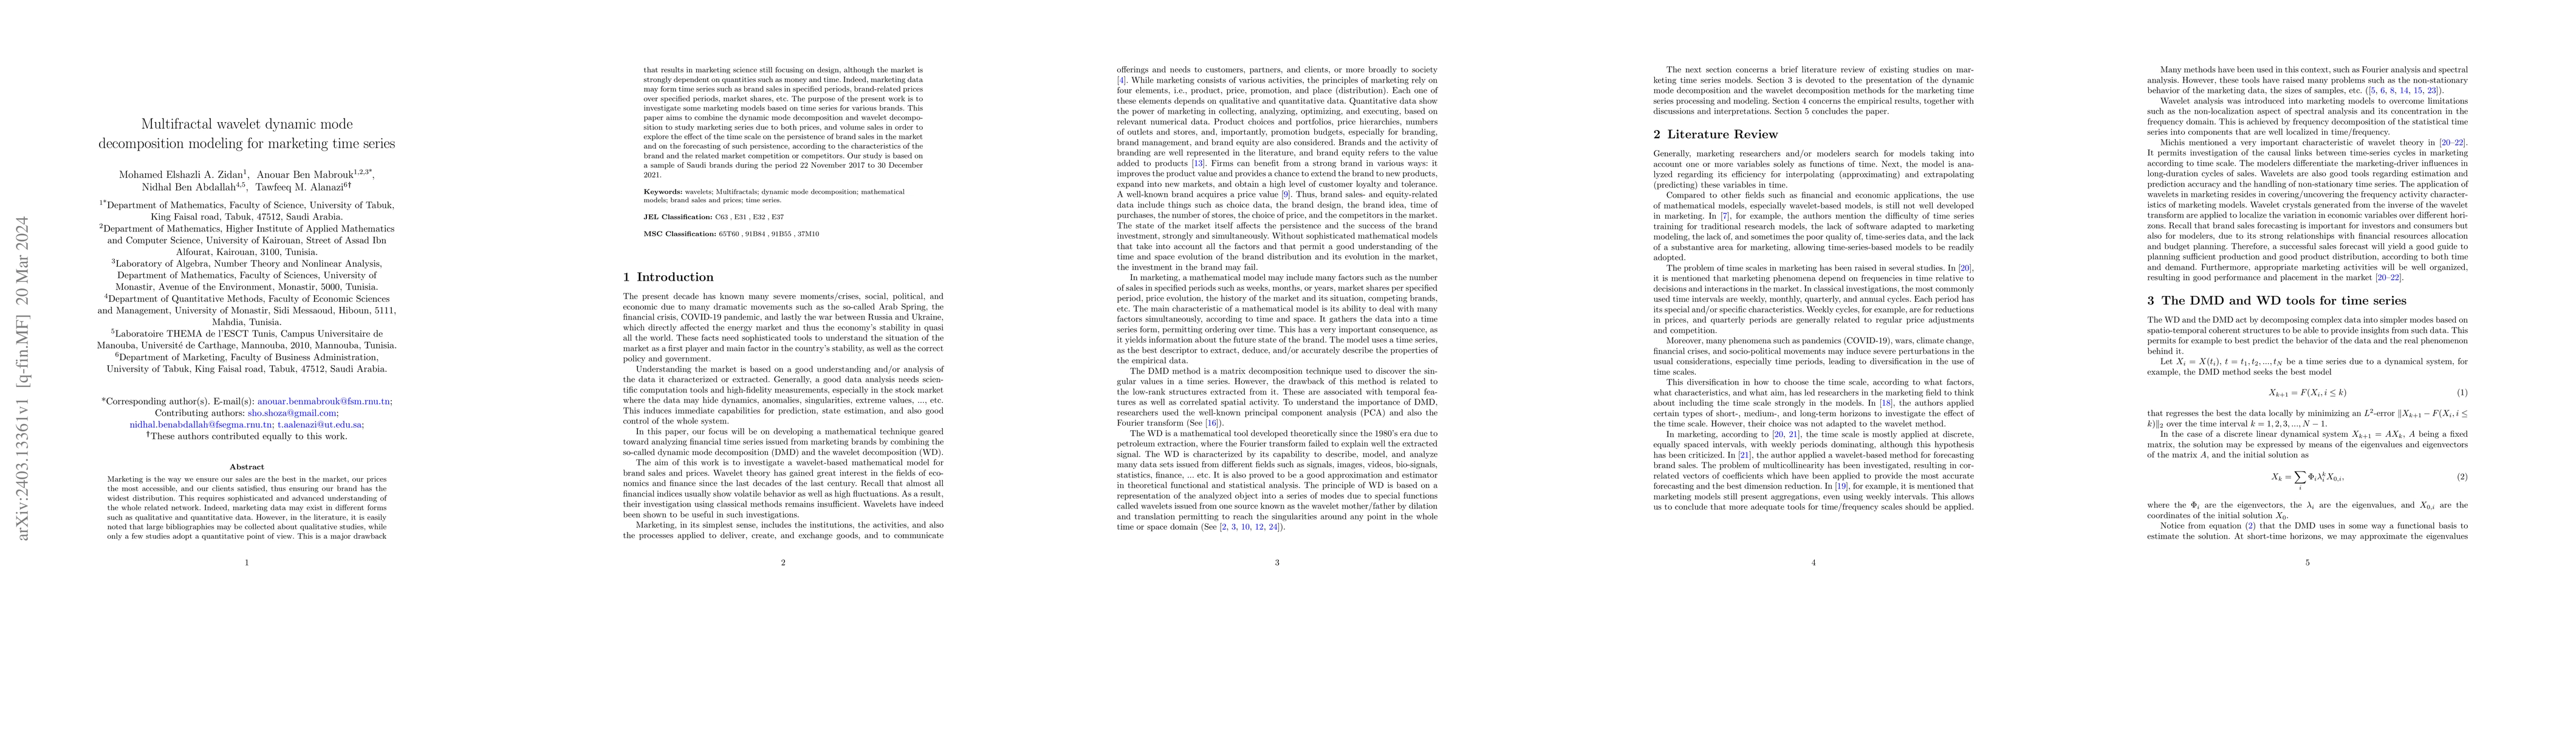
Marketing is the way we ensure our sales are the best in the market, our prices the most accessible, and our clients satisfied, thus ensuring our brand has the widest distribution. This requires sophisticated and advanced understanding of the whole related network. Indeed, marketing data may exist in different forms such as qualitative and quantitative data. However, in the literature, it is easily noted that large bibliographies may be collected about qualitative studies, while only a few studies adopt a quantitative point of view. This is a major drawback that results in marketing science still focusing on design, although the market is strongly dependent on quantities such as money and time. Indeed, marketing data may form time series such as brand sales in specified periods, brand-related prices over specified periods, market shares, etc. The purpose of the present work is to investigate some marketing models based on time series for various brands. This paper aims to combine the dynamic mode decomposition and wavelet decomposition to study marketing series due to both prices, and volume sales in order to explore the effect of the time scale on the persistence of brand sales in the market and on the forecasting of such persistence, according to the characteristics of the brand and the related market competition or competitors. Our study is based on a sample of Saudi brands during the period 22 November 2017 to 30 December 2021.
AI Key Findings
Get AI-generated insights about this paper's methodology, results, significance, and more — seven facets brought into focus.
Paper Details
Authors
PDF Preview
Key Terms
Related Papers
No references found for this paper.
Discussion 0