Multiple testing using uniform filtering of ordered p-values
Publication
Metrics
AI Quick Summary
This paper proposes a new adaptive filtering method for multiple testing to identify alternative hypotheses while controlling the false discovery rate. Unlike the BH method, it removes p-values from regions of uniform distribution, declaring remaining clustered p-values as alternatives based on data-dependent FDR control.
Paper Preview
Abstract
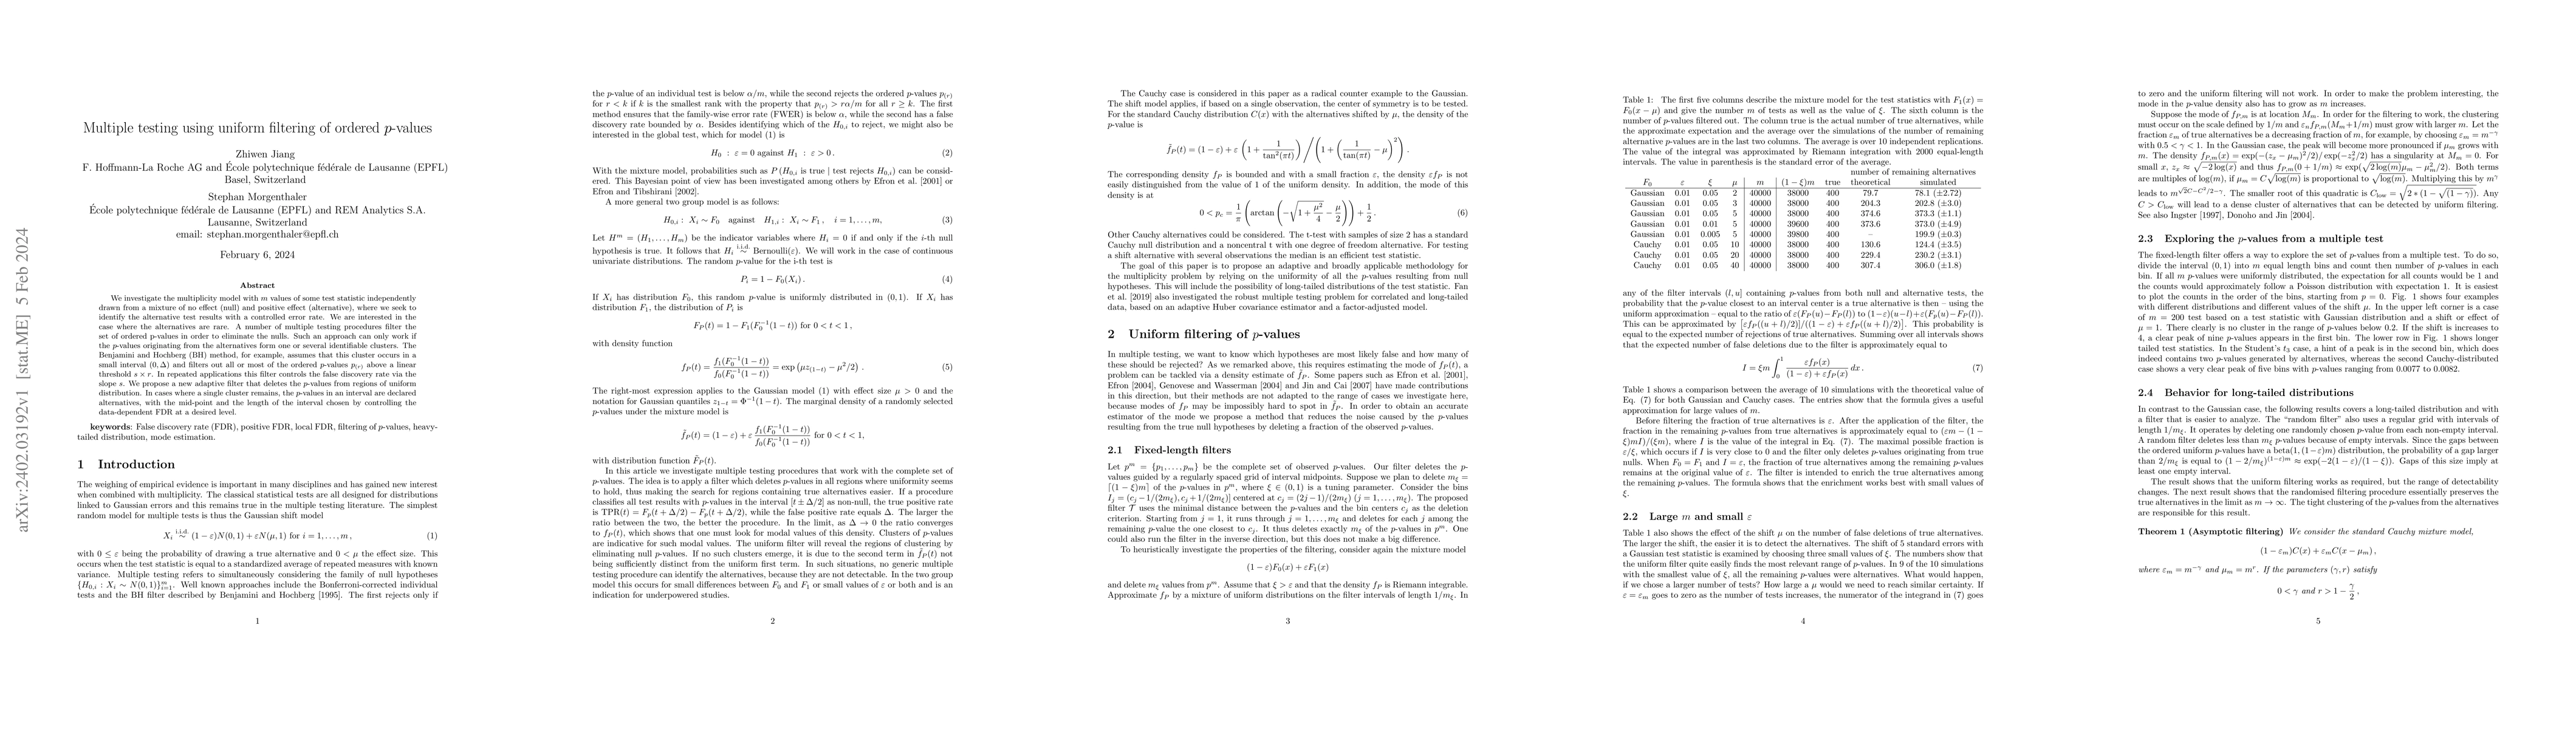
We investigate the multiplicity model with m values of some test statistic independently drawn from a mixture of no effect (null) and positive effect (alternative), where we seek to identify, the alternative test results with a controlled error rate. We are interested in the case where the alternatives are rare. A number of multiple testing procedures filter the set of ordered p-values in order to eliminate the nulls. Such an approach can only work if the p-values originating from the alternatives form one or several identifiable clusters. The Benjamini and Hochberg (BH) method, for example, assumes that this cluster occurs in a small interval $(0,\Delta)$ and filters out all or most of the ordered p-values $p_{(r)}$ above a linear threshold $s \times r$. In repeated applications this filter controls the false discovery rate via the slope s. We propose a new adaptive filter that deletes the p-values from regions of uniform distribution. In cases where a single cluster remains, the p-values in an interval are declared alternatives, with the mid-point and the length of the interval chosen by controlling the data-dependent FDR at a desired level.
AI Key Findings
Get AI-generated insights about this paper's methodology, results, significance, and more — seven facets brought into focus.
Impact
Paper Details
Authors
PDF Preview
Key Terms
Citation Network
Current paper (gray), citations (green), references (blue)
Display is limited for performance on very large graphs.
Discussion 0