Quick Summary:

This paper explores the use of Multiplex Visibility Graphs (MVG) to analyze correlations between ground level O3 and NO2 concentrations. The study introduces two parameters, Average Edge Overlap and Interlayer Mutual Information, which reveal time coherence and seasonal variations in pollutant correlations, respectively, suggesting MVG as a complementary tool for environmental time series analysis.

Summary

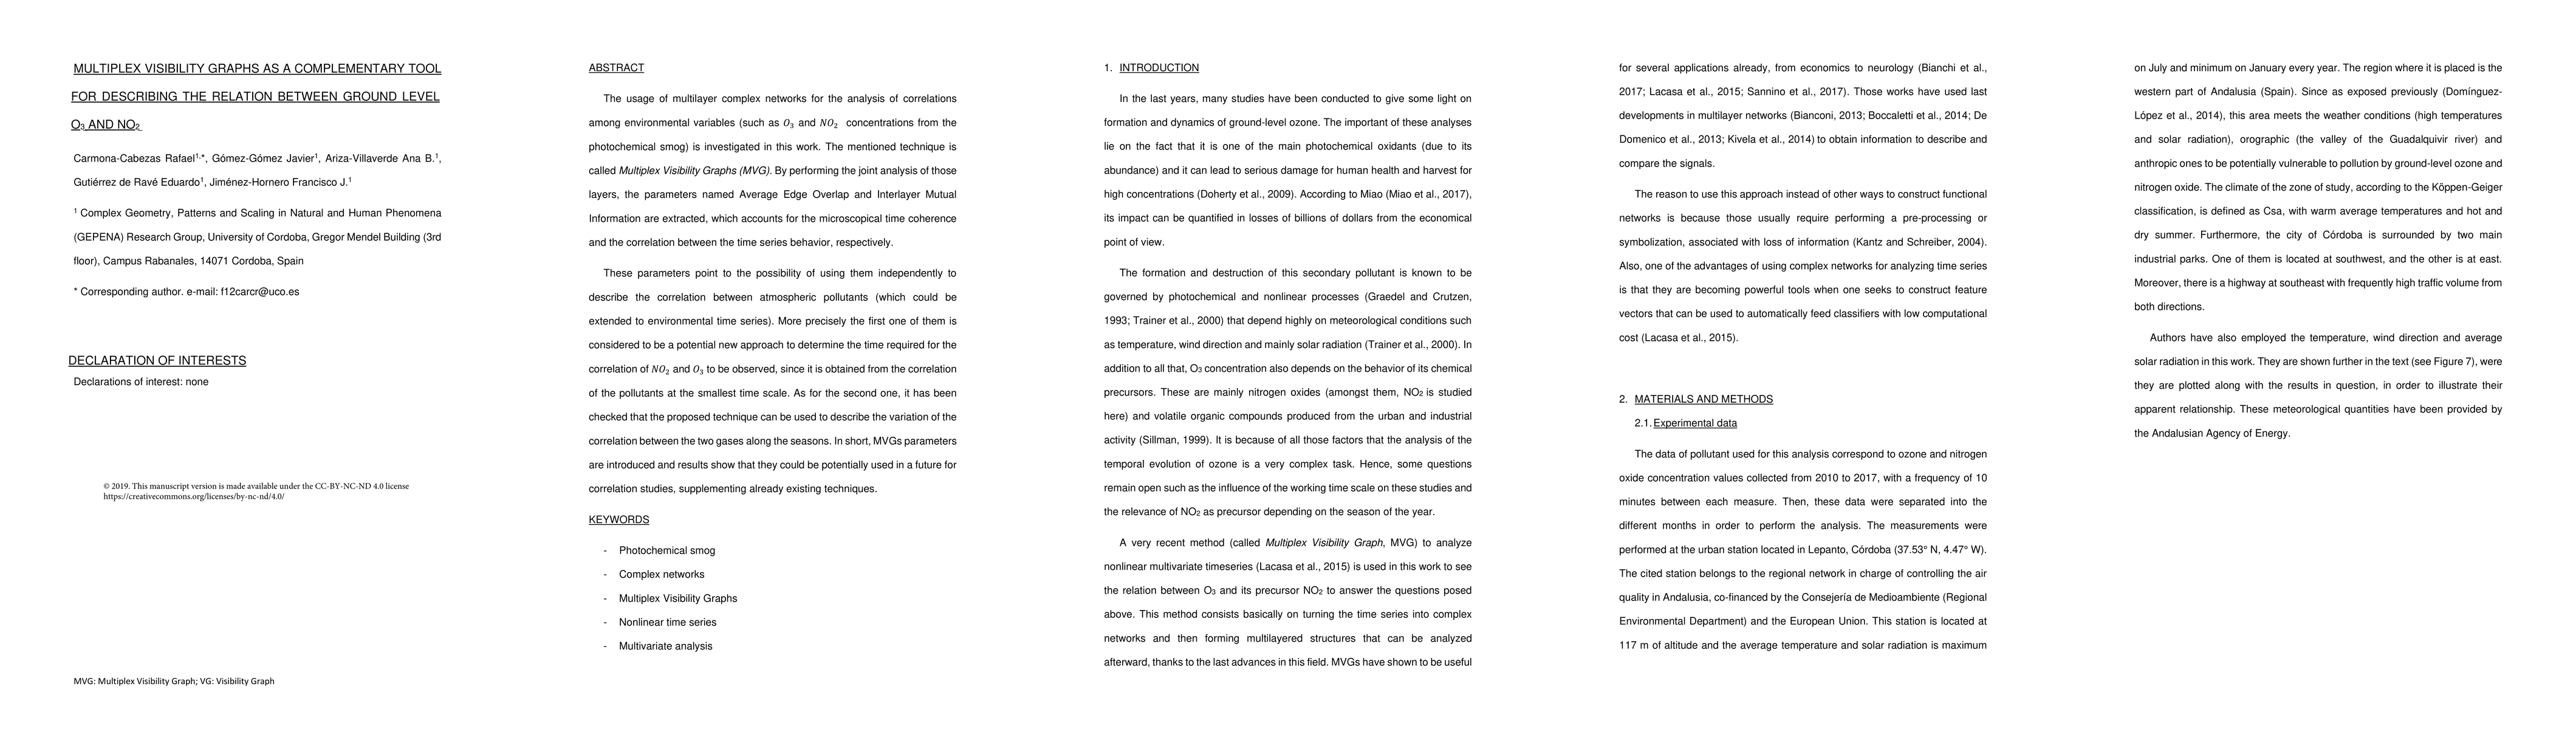
The usage of multilayer complex networks for the analysis of correlations among environmental variables (such as O3 and NO2 concentrations from the photochemical smog) is investigated in this work. The mentioned technique is called Multiplex Visibility Graphs (MVG). By performing the joint analysis of those layers, the parameters named Average Edge Overlap and Interlayer Mutual Information are extracted, which accounts for the microscopical time coherence and the correlation between the time series behavior, respectively. These parameters point to the possibility of using them independently to describe the correlation between atmospheric pollutants (which could be extended to environmental time series). More precisely the first one of them is considered to be a potential new approach to determine the time required for the correlation of NO2 and O3 to be observed, since it is obtained from the correlation of the pollutants at the smallest time scale. As for the second one, it has been checked that the proposed technique can be used to describe the variation of the correlation between the two gases along the seasons. In short, MVGs parameters are introduced and results show that they could be potentially used in a future for correlation studies, supplementing already existing techniques.

AI Key Findings

Get AI-generated insights about this paper's methodology, results, and significance.

Paper Details

PDF Preview

Download PDF

Key Terms

correlation (0.278)
environmental (0.227)
time series (0.223)
series (0.175)
technique (0.172)
parameters (0.169)
time (0.158)
gases (0.157)
concentrations (0.151)
time scale (0.148)
accounts (0.146)
mutual (0.145)
overlap (0.144)
atmospheric (0.144)
smallest (0.143)
mentioned (0.143)
usage (0.140)
new approach (0.140)
named (0.133)
coherence (0.133)

Citation Network

Current paper (gray), citations (green), references (blue)

Current Paper
Citations
References
Click to view
Title Authors Year Actions
Fractal, Spectral, and Topological Analysis of the Reservoir-Induced Seismicity of Pertusillo Area (Southern Italy)
Luciano Telesca, S. Panebianco, V. Serlenga, T. Stabile
2025
View Paper
Elucidating transport dynamics and regional division of PM2.5 and O3 in China using an advanced network model.
Xiaosong Hou, Xiaoqi Wang, Shuiyuan Cheng, Haoyun Qi, Chuanda Wang, Zijian Huang
2024
View Paper
Identifying nonlinear interactions between PM2.5 and O3 on small time scales with visibility graph approaches
Shengwei Liu, Zuntao Fu
2023
View Paper
Environmental pollution in North-Eastern Italy and its influence on chronic obstructive pulmonary disease: time series modelling and analysis using visibility graphs
Alejandra Aranburu-Imatz, J. E. Jiménez-Hornero, I. Morales-Cané, P. López-Soto
2023
View Paper
Daylight Saving Time transitions and Cardiovascular Disease in Andalusia: Time Series Modeling and Analysis Using Visibility Graphs
F. Rodríguez-Cortés, J. E. Jiménez-Hornero, J. Alcalá-Díaz, F. J. Jiménez-Hornero, J. L. Romero-Cabrera, R. Cappadona, R. Manfredini, P. López-Soto
2022
View Paper
Analysis of Stock Price Data: Determinition of The Optimal Sliding-Window Length
Xuebin Liu, Xuesong Yuan, Chang Liu, Hao Ma, Chongyang Lian
2021
View Paper
EKC Test of the Relationship between Nitrogen Dioxide Pollution and Economic Growth—A Spatial Econometric Analysis Based on Chinese City Data
C. Han, Zhaolin Gu, Hexiang Yang
2021
View Paper
Wet scavenging process of particulate matter (PM10): A multivariate complex network approach
Thomas Plocoste, Rafael Carmona-Cabezas, E. G. de Ravé, F. J. Jiménez-Hornero
2021
View Paper
Multifractal characterisation of particulate matter (PM10) time series in the Caribbean basin using visibility graphs
Thomas Plocoste, Rafael Carmona-Cabezas, F. J. Jiménez-Hornero, E. Gutiérrez de Ravé, R. Calif
2020
View Paper
Complex network recognition of electrocardiograph signals in health and myocardial infarction patients based on multiplex visibility graph
Zhi-Yi Ma, Xiao‐dong Yang, Aijun He, Lu Ma, Jui-Pin Wang
2022
View Paper
Multivariate emotional EEG signal recognition based on multivariate joint motif entropy of a horizontal visibility graph
杨小冬
View Paper

Comments (0)

This website uses cookies to ensure you get the best experience. Learn more