Multiscale modelling of animal movement with persistent dynamics
Publication
Metrics
AI Quick Summary
This research proposes a multiscale model for animal movement based on the underdamped Langevin process, which combines local movement decisions with global spatial distributions. The model is flexible, continuous in time, and incorporates time-varying parameters, allowing it to be applied at different observational scales.
Paper Preview
Abstract
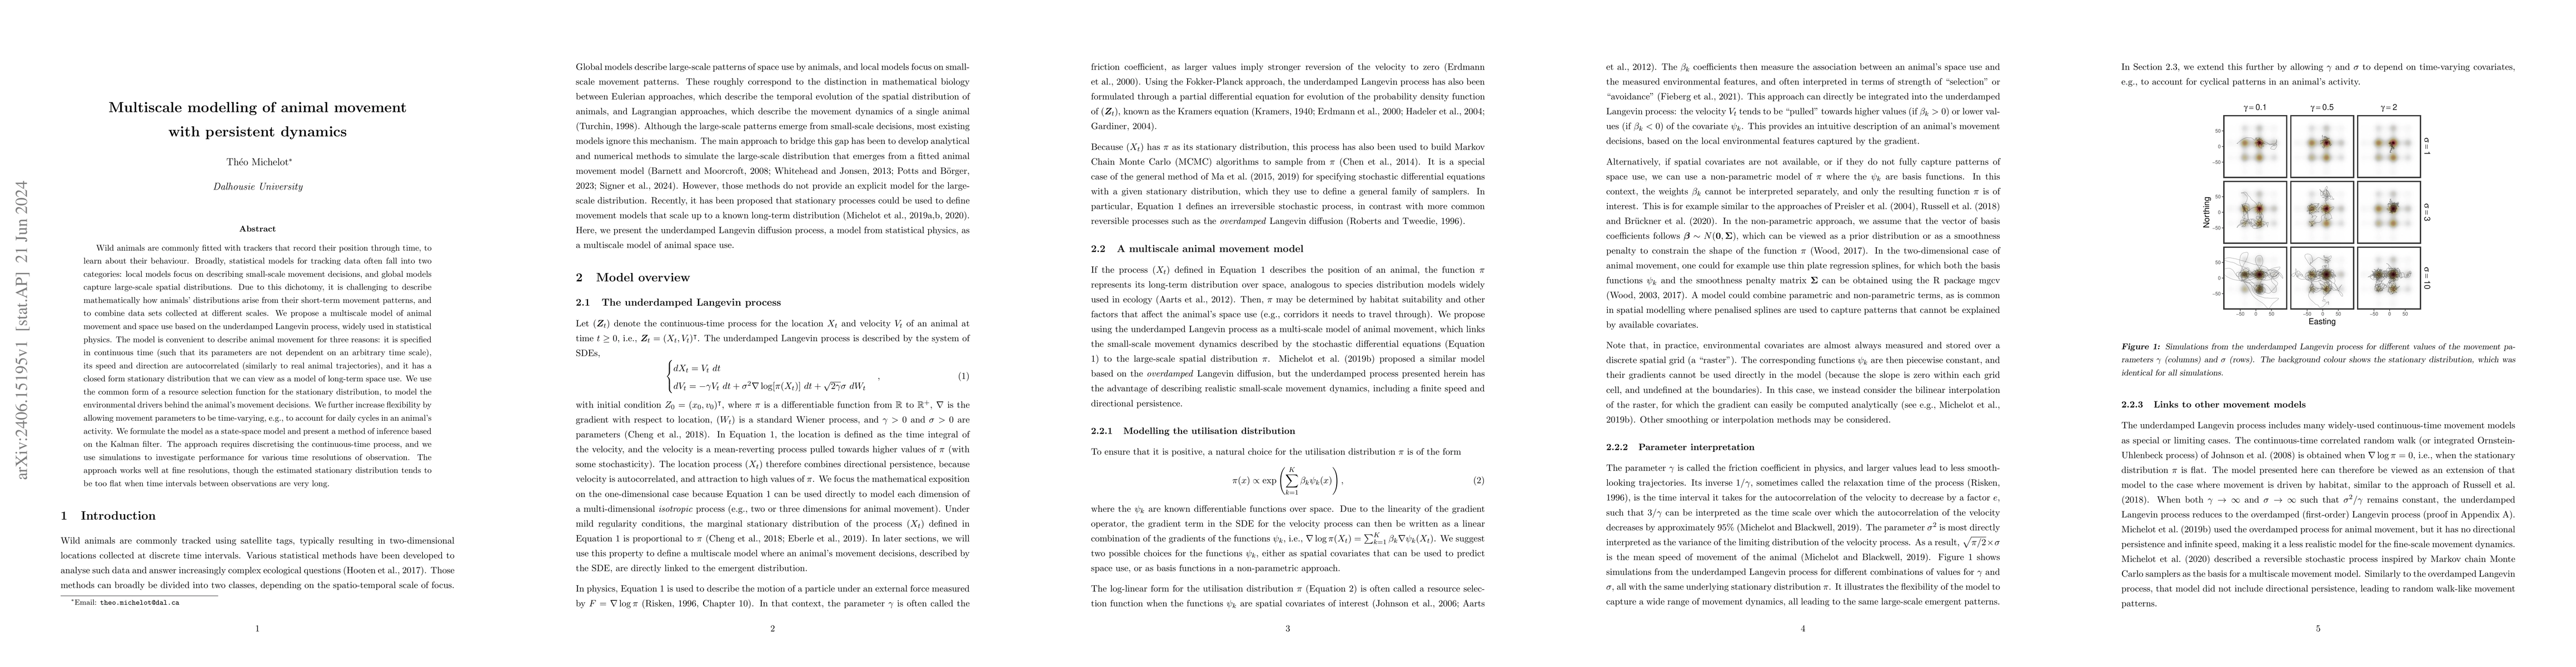
Wild animals are commonly fitted with trackers that record their position through time, to learn about their behaviour. Broadly, statistical models for tracking data often fall into two categories: local models focus on describing small-scale movement decisions, and global models capture large-scale spatial distributions. Due to this dichotomy, it is challenging to describe mathematically how animals' distributions arise from their short-term movement patterns, and to combine data sets collected at different scales. We propose a multiscale model of animal movement and space use based on the underdamped Langevin process, widely used in statistical physics. The model is convenient to describe animal movement for three reasons: it is specified in continuous time (such that its parameters are not dependent on an arbitrary time scale), its speed and direction are autocorrelated (similarly to real animal trajectories), and it has a closed form stationary distribution that we can view as a model of long-term space use. We use the common form of a resource selection function for the stationary distribution, to model the environmental drivers behind the animal's movement decisions. We further increase flexibility by allowing movement parameters to be time-varying, e.g., to account for daily cycles in an animal's activity. We formulate the model as a state-space model and present a method of inference based on the Kalman filter. The approach requires discretising the continuous-time process, and we use simulations to investigate performance for various time resolutions of observation. The approach works well at fine resolutions, though the estimated stationary distribution tends to be too flat when time intervals between observations are very long.
AI Key Findings
Get AI-generated insights about this paper's methodology, results, significance, and more — seven facets brought into focus.
Impact
Paper Details
Authors
PDF Preview
Key Terms
Citation Network
Current paper (gray), citations (green), references (blue)
Display is limited for performance on very large graphs.
Discussion 0