Publication
Metrics
AI Quick Summary
This study experimentally analyzes the temporal structural diversity in laser beam wandering through isotropic turbulence using multiscale permutation entropy. The research reveals a crossover between two scaling regimes, transitioning from electronic noise to fractional Brownian motion with a Hurst exponent of 5/6, and correlates these findings with numerical simulations.
Paper Preview
Abstract
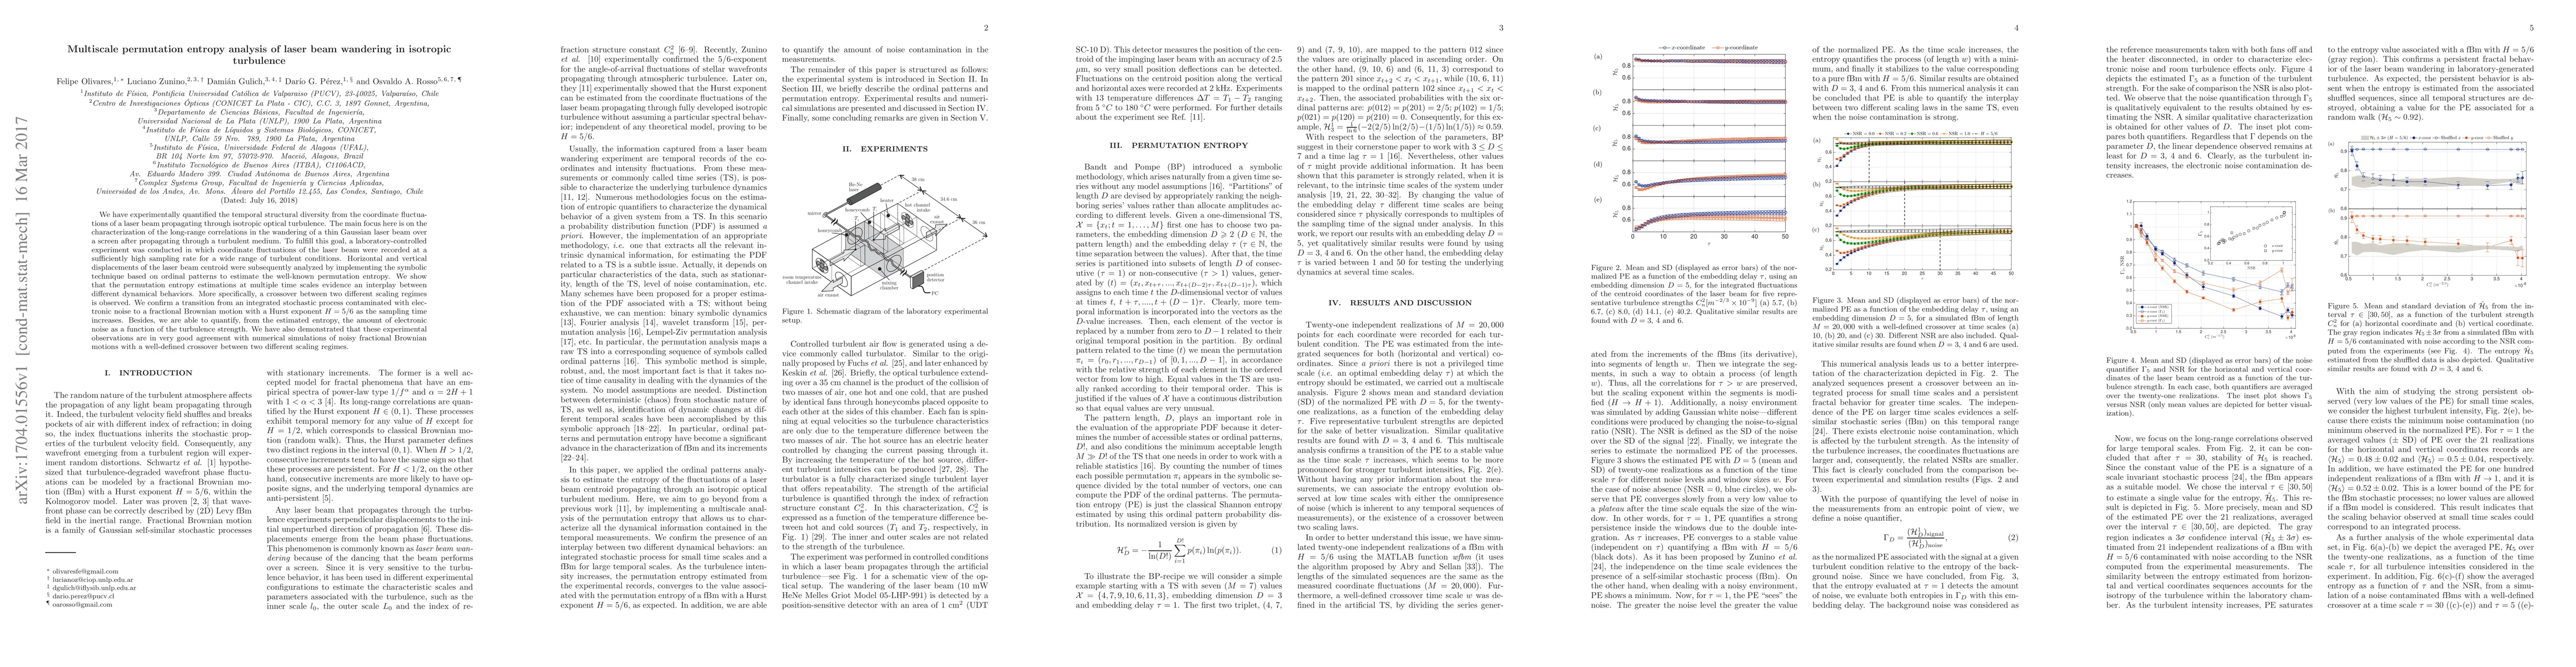
We have experimentally quantified the temporal structural diversity from the coordinate fluctuations of a laser beam propagating through isotropic optical turbulence. The main focus here is on the characterization of the long-range correlations in the wandering of a thin Gaussian laser beam over a screen after propagating through a turbulent medium. To fulfill this goal, a laboratory-controlled experiment was conducted in which coordinate fluctuations of the laser beam were recorded at a sufficiently high sampling rate for a wide range of turbulent conditions. Horizontal and vertical displacements of the laser beam centroid were subsequently analyzed by implementing the symbolic technique based on ordinal patterns to estimate the well-known permutation entropy. We show that the permutation entropy estimations at multiple time scales evidence an interplay between different dynamical behaviors. More specifically, a crossover between two different scaling regimes is observed. We confirm a transition from an integrated stochastic process contaminated with electronic noise to a fractional Brownian motion with a Hurst exponent H = 5/6 as the sampling time increases. Besides, we are able to quantify, from the estimated entropy, the amount of electronic noise as a function of the turbulence strength. We have also demonstrated that these experimental observations are in very good agreement with numerical simulations of noisy fractional Brownian motions with a well-defined crossover between two different scaling regimes.
AI Key Findings
Get AI-generated insights about this paper's methodology, results, significance, and more — seven facets brought into focus.
Impact
Paper Details
PDF Preview
Key Terms
Citation Network
Current paper (gray), citations (green), references (blue)
Display is limited for performance on very large graphs.
Discussion 0