ArxivLens

Publication

Published: Apr 08, 2026
Categories: physics.ins-det, physics.geo-ph, stat.AP

Metrics

Source: ArXiv

Quick Answers

What methodology did the authors use?

Spectral decomposition of DAS strain-rate into predefined frequency bands, computation of band-limited energy images, mapping to RGB-like composites, and evaluation via visualization, k‑means clustering, and ResNet‑18 classification. More in Methodology →

What are the key results?

Multispectral RGB composites provide clear spectral discrimination between whale vocalizations and background noise, and between different call types. — Unsupervised k‑means clustering on multispectral features separates acoustic patterns such as Fin Whale calls and background noise without labels. More in Key Results →

Why is this work significant?

The framework offers a physically interpretable, image‑based representation that enhances visualization and enables automated analysis of large DAS datasets, benefiting marine bioacoustics and other monitoring applications. More in Significance →

What are the main limitations?

Simple k‑means clustering may fail to separate overlapping or subtle acoustic events due to spectral noise. — CNN performance can degrade for faint or small‑proportion vocalizations because of preprocessing and 8‑bit intensity conversion. More in Limitations →

Paper Preview

Abstract

Distributed Acoustic Sensing (DAS) enables continuous monitoring of dynamic strain along tens of kilometers of optical fiber, generating massive datasets whose interpretation and automated analysis remain challenging. DAS measurements often lack a standardized visual representation, and their physical interpretation depends strongly on acquisition conditions and signal processing choices. This work introduces a systematic framework for visualization and feature extraction of DAS data based on a multispectral signal representation. The approach decomposes strain-rate measurements into predefined frequency bands and computes band-limited energy images that describe the spatial and temporal distribution of acoustic energy across distinct spectral regimes. The framework is evaluated using DAS recordings containing Fin Whale (Balaenoptera physalus) and Blue Whale (Balaenoptera musculus) vocalizations. Three experiments are conducted to assess the approach: enhanced visualization of bioacoustic signals, unsupervised clustering of acoustic patterns, and supervised event detection using a convolutional neural network. Using multispectral composites as input, a ResNet-18 classifier achieves an accuracy of 97.3% in whale vocalization detection, demonstrating that the proposed representation captures biologically meaningful spectral structure and provides an effective feature space for automated analysis of DAS data.
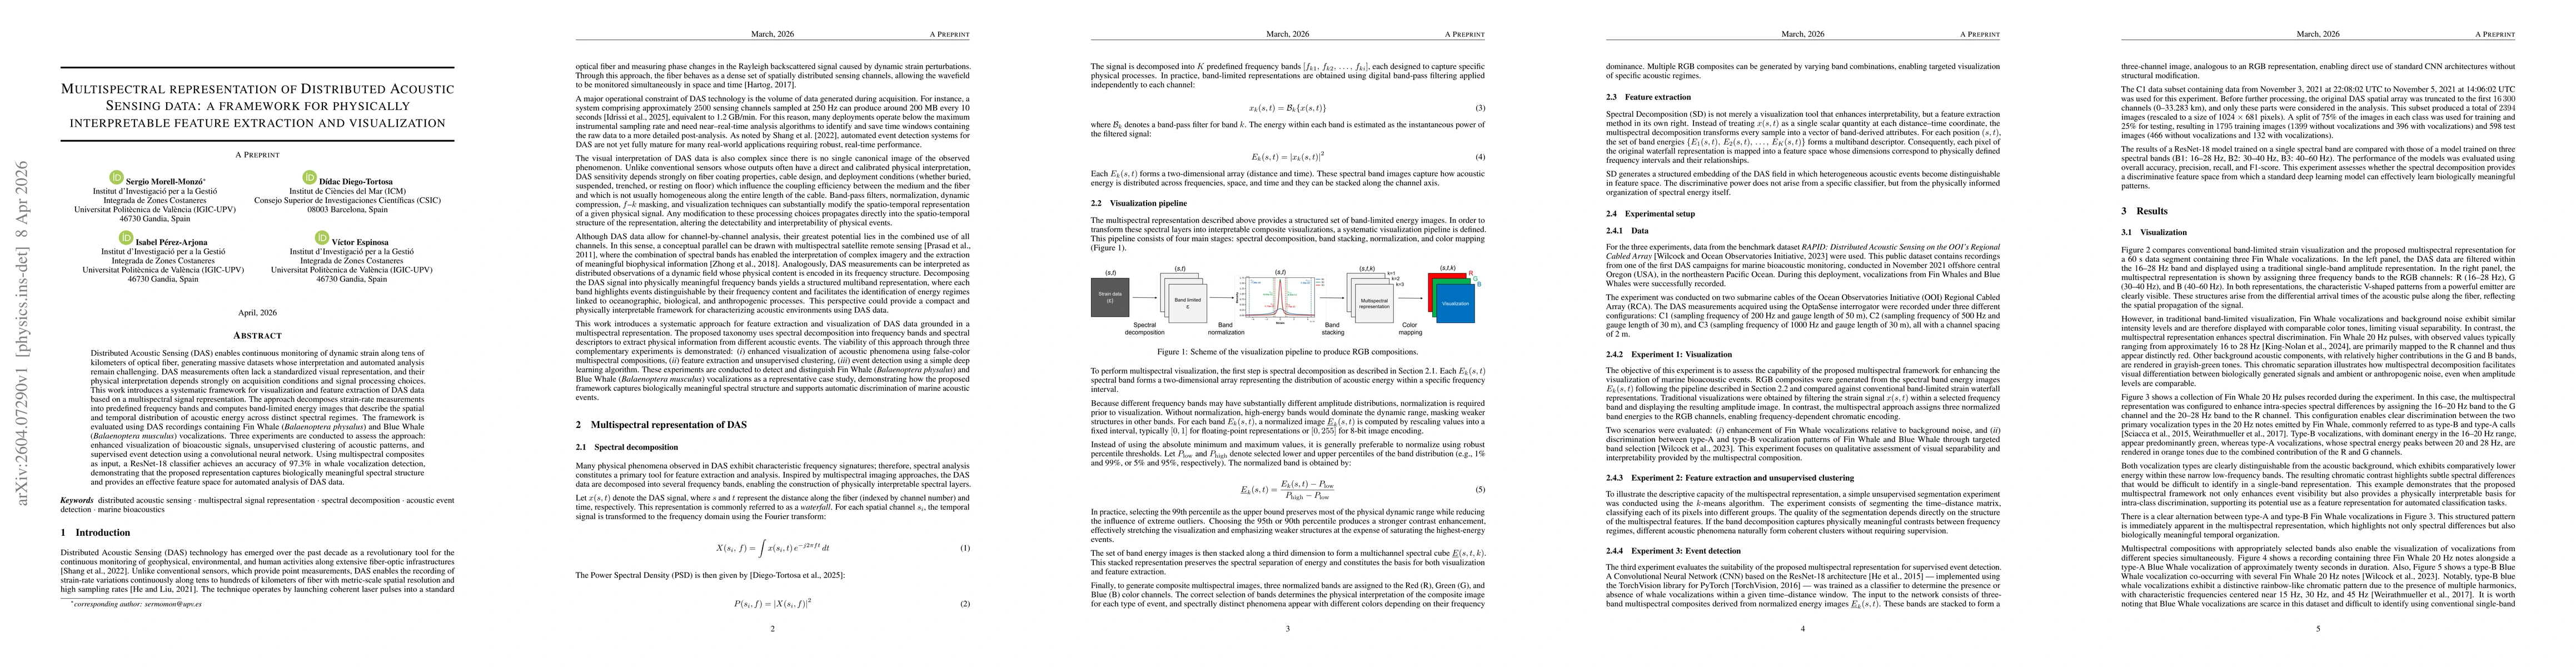
Key Findings, in focus

Seven facets of this paper, analysed and brought into focus by AI.

AI-generated · verify against source Generated Apr 09, 2026
In focus · one-line synthesis

The framework offers a physically interpretable, image‑based representation that enhances visualization and enables automated analysis of large DAS datasets, benefiting marine bioacoustics and other monitoring applications.

01
MethodologyHow they did it

Spectral decomposition of DAS strain-rate into predefined frequency bands, computation of band-limited energy images, mapping to RGB-like composites, and evaluation via visualization, k‑means clustering, and ResNet‑18 classification.

02
ResultsWhat they found
  • Multispectral RGB composites provide clear spectral discrimination between whale vocalizations and background noise, and between different call types.
  • Unsupervised k‑means clustering on multispectral features separates acoustic patterns such as Fin Whale calls and background noise without labels.
  • A ResNet‑18 classifier trained on three‑band composites achieves 97.3% accuracy in whale vocalization detection, outperforming single‑band baselines.
03
SignificanceWhy it matters

The framework offers a physically interpretable, image‑based representation that enhances visualization and enables automated analysis of large DAS datasets, benefiting marine bioacoustics and other monitoring applications.

04
Technical ContributionsWhat's new technically

A systematic multispectral representation that transforms DAS strain-rate into a structured, RGB‑like feature space, enabling both enhanced visualization and compatibility with modern computer‑vision pipelines.

05
NoveltyWhat sets it apart

First to combine physically defined spectral bands with image‑based composites for DAS, bridging traditional spectral analysis with deep‑learning‑friendly representations.

06
LimitationsWhat to be cautious about
  • Simple k‑means clustering may fail to separate overlapping or subtle acoustic events due to spectral noise.
  • CNN performance can degrade for faint or small‑proportion vocalizations because of preprocessing and 8‑bit intensity conversion.
07
Future WorkWhere it goes next
  • Extend the spectral decomposition with additional bands and more sophisticated clustering or deep‑learning models to improve discrimination.
  • Apply the multispectral framework to other DAS monitoring scenarios such as geophysical, environmental, or anthropogenic signal detection.

Paper Details

Paper ID: 2604.07290
Categories:
physics.ins-det physics.geo-ph stat.AP

How to Cite This Paper

Reference manager: RIS EndNote


Discussion 0

This website uses cookies to ensure you get the best experience. Learn more