Multivariate Regression of Mixed Responses for Evaluation of Visualization Designs
Publication
Metrics
Paper Preview
Abstract
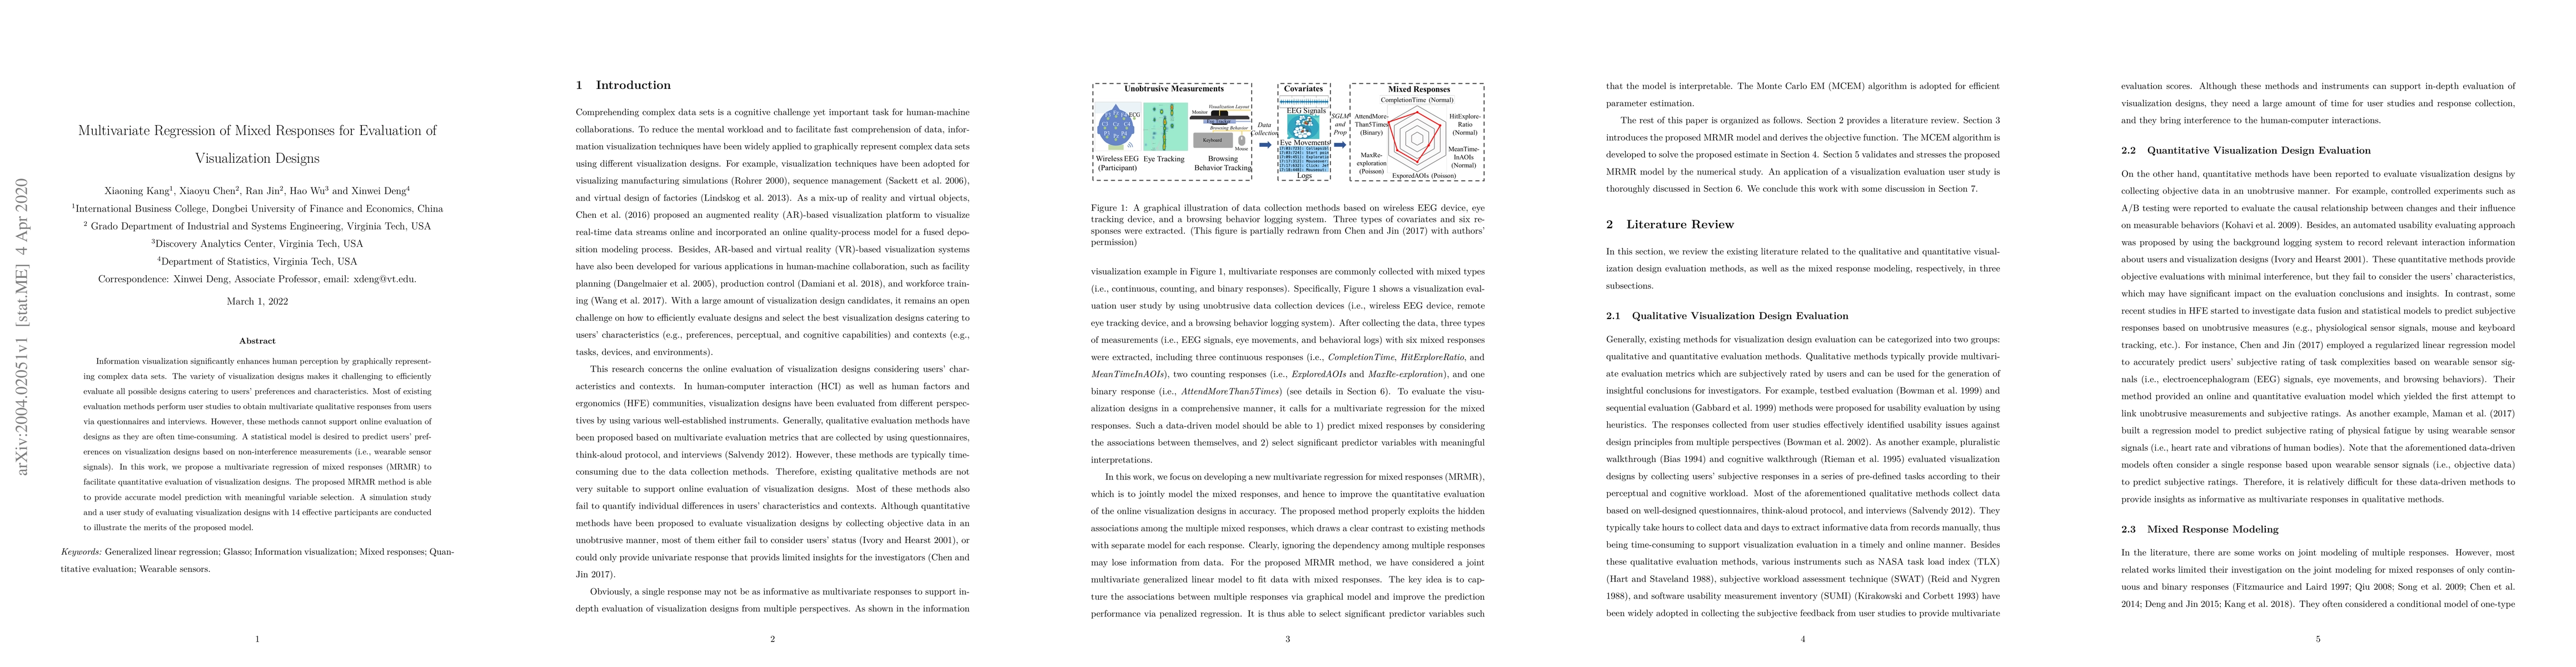
Information visualization significantly enhances human perception by graphically representing complex data sets. The variety of visualization designs makes it challenging to efficiently evaluate all possible designs catering to users' preferences and characteristics. Most of existing evaluation methods perform user studies to obtain multivariate qualitative responses from users via questionnaires and interviews. However, these methods cannot support online evaluation of designs as they are often time-consuming. A statistical model is desired to predict users' preferences on visualization designs based on non-interference measurements (i.e., wearable sensor signals). In this work, we propose a multivariate regression of mixed responses (MRMR) to facilitate quantitative evaluation of visualization designs. The proposed MRMR method is able to provide accurate model prediction with meaningful variable selection. A simulation study and a user study of evaluating visualization designs with 14 effective participants are conducted to illustrate the merits of the proposed model.
AI Key Findings
Get AI-generated insights about this paper's methodology, results, significance, and more — seven facets brought into focus.
Impact
Paper Details
Authors
PDF Preview
Key Terms
Citation Network
Current paper (gray), citations (green), references (blue)
Display is limited for performance on very large graphs.
Discussion 0