Multivariate Time Series Anomaly Detection via Dynamic Graph Forecasting
Publication
Metrics
AI Quick Summary
This paper proposes DyGraphAD, a framework for multivariate time series anomaly detection using dynamic inter-series graphs. It aims to detect anomalies by observing deviations in inter-series relationships and intra-series temporal patterns, leveraging evolving graphs to enhance forecasting tasks and achieve superior performance compared to baseline methods.
Paper Preview
Abstract
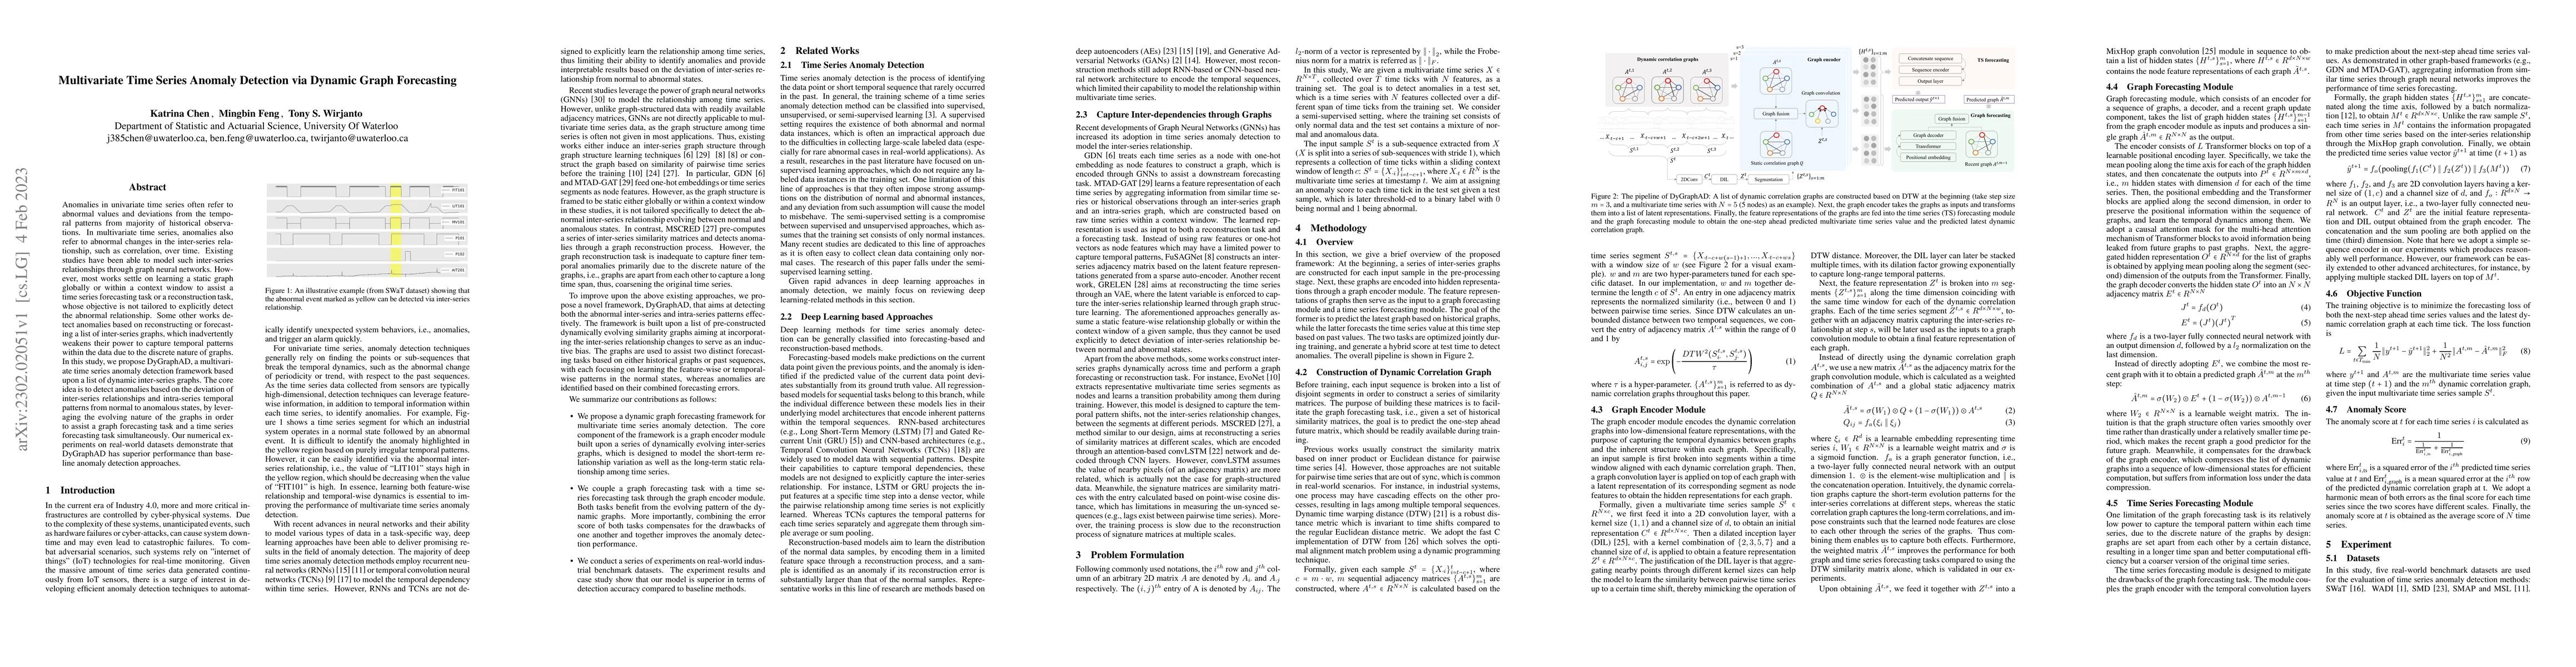
Anomalies in univariate time series often refer to abnormal values and deviations from the temporal patterns from majority of historical observations. In multivariate time series, anomalies also refer to abnormal changes in the inter-series relationship, such as correlation, over time. Existing studies have been able to model such inter-series relationships through graph neural networks. However, most works settle on learning a static graph globally or within a context window to assist a time series forecasting task or a reconstruction task, whose objective is not tailored to explicitly detect the abnormal relationship. Some other works detect anomalies based on reconstructing or forecasting a list of inter-series graphs, which inadvertently weakens their power to capture temporal patterns within the data due to the discrete nature of graphs. In this study, we propose DyGraphAD, a multivariate time series anomaly detection framework based upon a list of dynamic inter-series graphs. The core idea is to detect anomalies based on the deviation of inter-series relationships and intra-series temporal patterns from normal to anomalous states, by leveraging the evolving nature of the graphs in order to assist a graph forecasting task and a time series forecasting task simultaneously. Our numerical experiments on real-world datasets demonstrate that DyGraphAD has superior performance than baseline anomaly detection approaches.
AI Key Findings
Get AI-generated insights about this paper's methodology, results, significance, and more — seven facets brought into focus.
Impact
Paper Details
Authors
PDF Preview
Key Terms
Citation Network
Current paper (gray), citations (green), references (blue)
Display is limited for performance on very large graphs.
Discussion 0