MultiViz: A Gephi Plugin for Scalable Visualization of Multi-Layer Networks
Publication
Metrics
AI Quick Summary
The "MultiViz Plugin" for Gephi enables scalable visualization of multi-layer networks, offering users control over layout algorithms and layer properties. The plugin demonstrates its effectiveness by visualizing complex real-life multi-layer datasets.
Paper Preview
Abstract
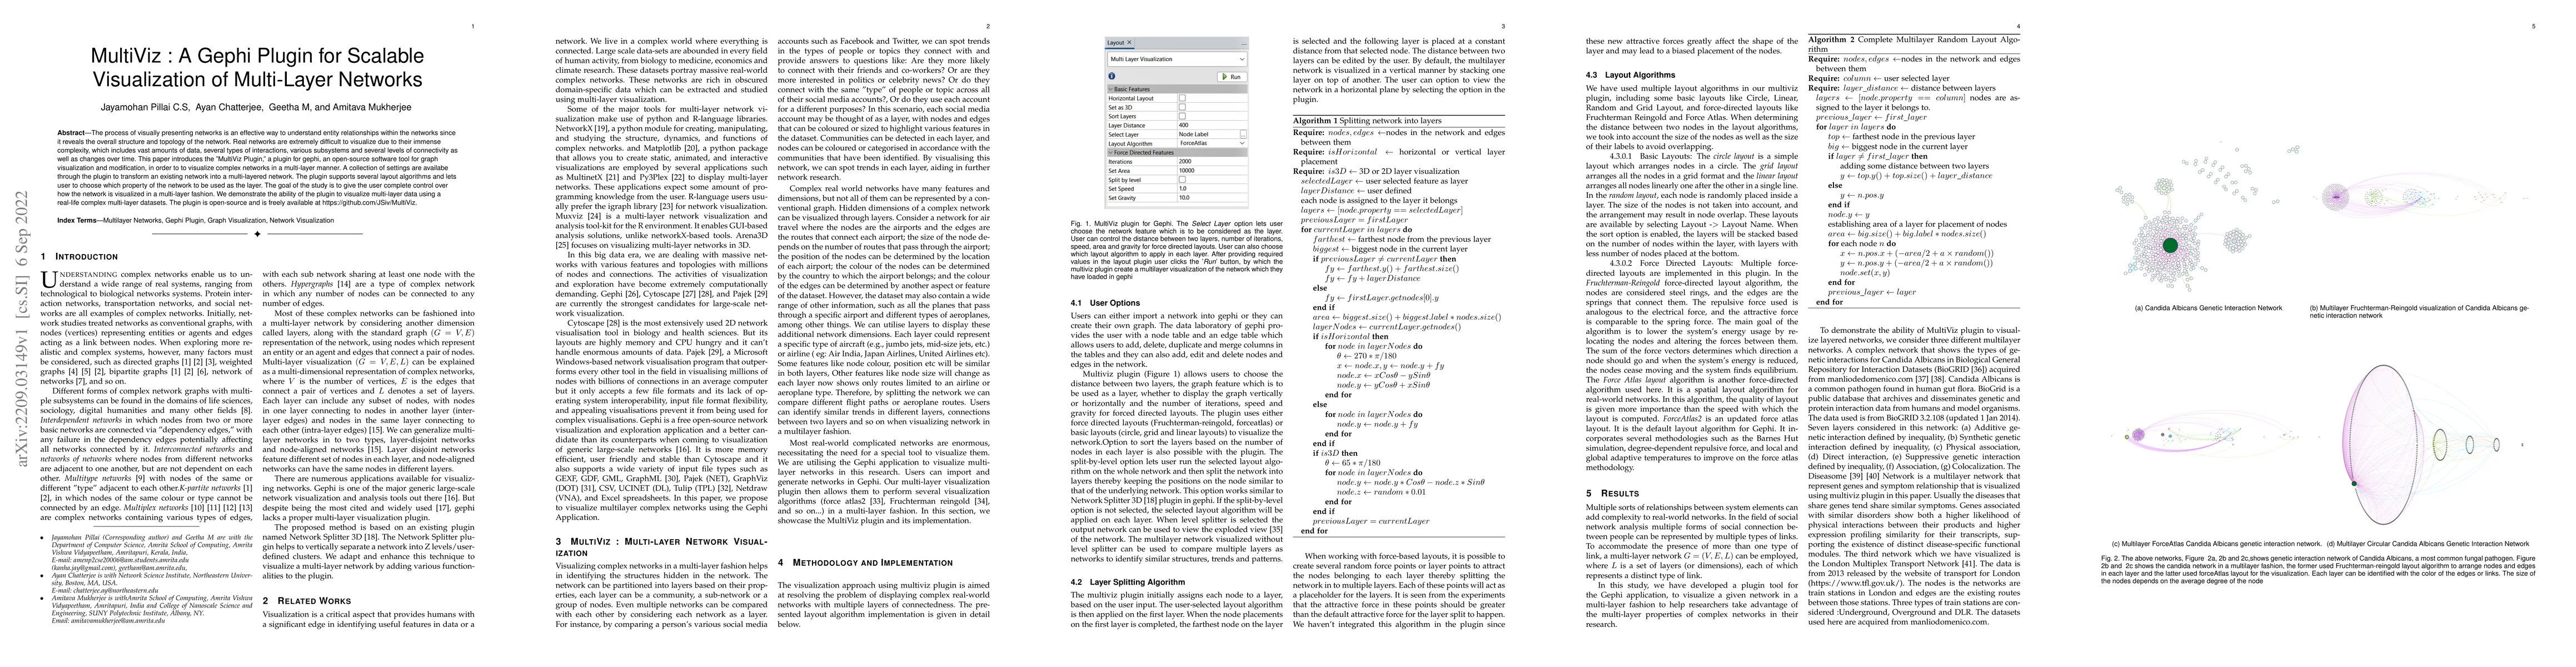
The process of visually presenting networks is an effective way to understand entity relationships within the networks since it reveals the overall structure and topology of the network. Real networks are extremely difficult to visualize due to their immense complexity, which includes vast amounts of data, several types of interactions, various subsystems and several levels of connectivity as well as changes over time. This paper introduces the "MultiViz Plugin," a plugin for gephi, an open-source software tool for graph visualization and modification, in order to to visualize complex networks in a multi-layer manner. A collection of settings are availabe through the plugin to transform an existing network into a multi-layered network. The plugin supports several layout algorithms and lets user to choose which property of the network to be used as the layer. The goal of the study is to give the user complete control over how the network is visualized in a multi-layer fashion. We demonstrate the ability of the plugin to visualize multi-layer data using a real-life complex multi-layer datasets.
AI Key Findings
Get AI-generated insights about this paper's methodology, results, significance, and more — seven facets brought into focus.
Impact
Paper Details
Authors
PDF Preview
Key Terms
Citation Network
Current paper (gray), citations (green), references (blue)
Display is limited for performance on very large graphs.
Discussion 0