Summary
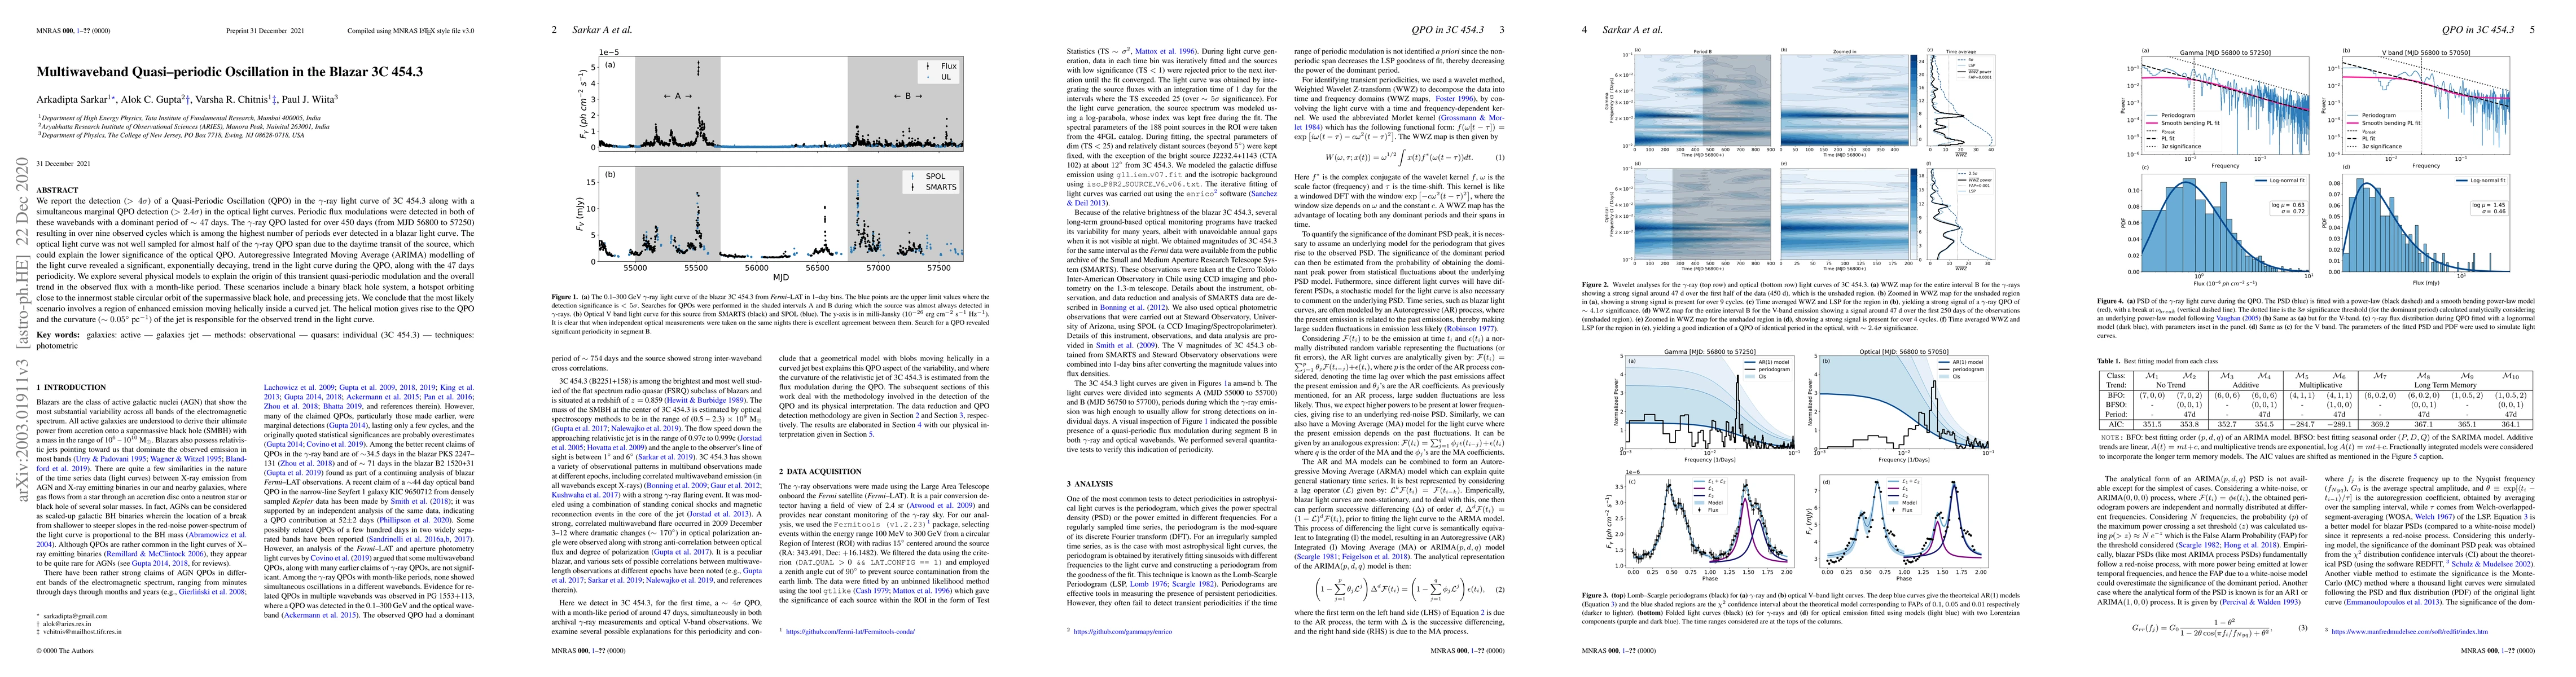
We report the detection ($>4\sigma$) of a Quasi-Periodic Oscillation (QPO) in the $\gamma$-ray light curve of 3C 454.3 along with a simultaneous marginal QPO detection ($>2.4\sigma$) in the optical light curves. Periodic flux modulations were detected in both of these wavebands with a dominant period of $\sim 47$ days. The $\gamma$-ray QPO lasted for over 450 days (from MJD 56800 to 57250) resulting in over nine observed cycles which is among the highest number of periods ever detected in a blazar light curve. The optical light curve was not well sampled for almost half of the $\gamma$-ray QPO span due to the daytime transit of the source, which could explain the lower significance of the optical QPO. Autoregressive Integrated Moving Average (ARIMA) modelling of the light curve revealed a significant, exponentially decaying, trend in the light curve during the QPO, along with the $47$ days periodicity. We explore several physical models to explain the origin of this transient quasi-periodic modulation and the overall trend in the observed flux with a month-like period. These scenarios include a binary black hole system, a hotspot orbiting close to the innermost stable circular orbit of the supermassive black hole, and precessing jets. We conclude that the most likely scenario involves a region of enhanced emission moving helically inside a curved jet. The helical motion gives rise to the QPO and the curvature ($\sim 0.05^{\circ}$ pc$^{-1}$) of the jet is responsible for the observed trend in the light curve.
AI Key Findings
Get AI-generated insights about this paper's methodology, results, and significance.
Paper Details
PDF Preview
Key Terms
Citation Network
Current paper (gray), citations (green), references (blue)
Display is limited for performance on very large graphs.
Similar Papers
Found 4 papers| Title | Authors | Year | Actions |
|---|
Comments (0)