Publication
Metrics
AI Quick Summary
This study analyzes the variability of Miras in the LMC across 14 bands (0.5-24 microns), finding that variability amplitude ratio decreases with increasing wavelength for both O-rich and C-rich Miras. Phase-lag increases slightly with wavelength. Synthetic period-luminosity relations (PLRs) are derived for various surveys, showing PLR slope decreases with wavelength for both Mira types. The research also explores Mira locations on color-magnitude and color-color diagrams.
Paper Preview
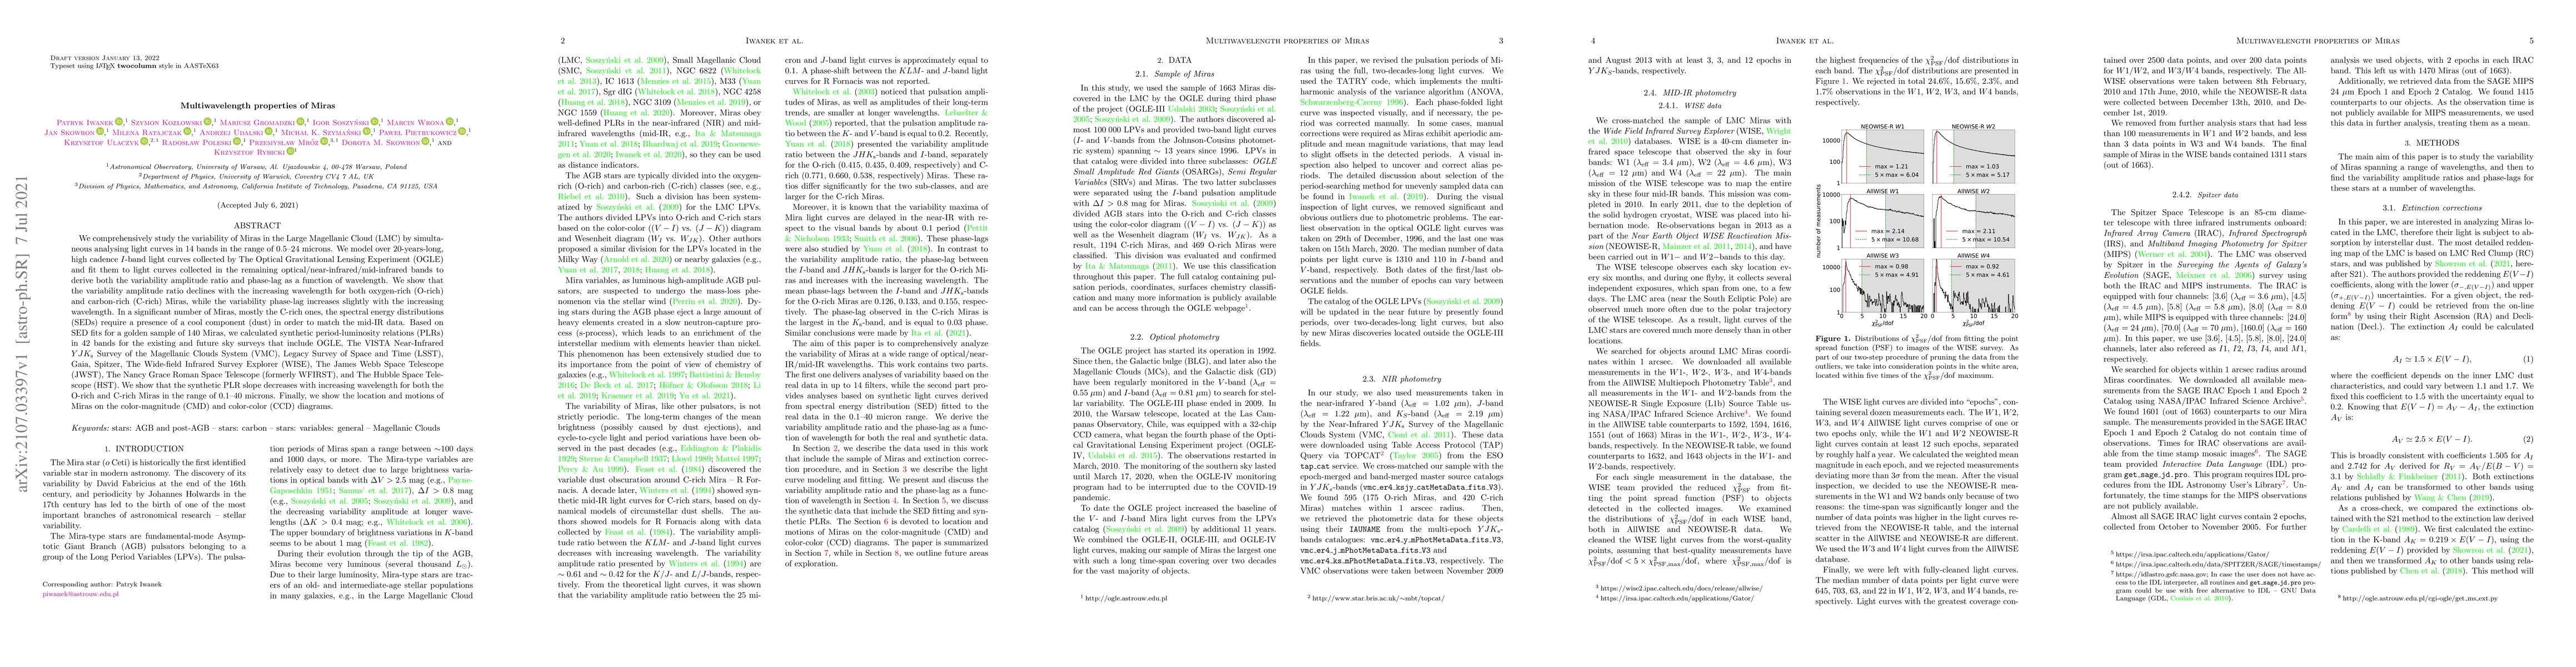
Abstract
We comprehensively study the variability of Miras in the Large Magellanic Cloud (LMC) by simultaneous analysing light curves in 14 bands in the range of 0.5$-$24 microns. We model over 20-years-long, high cadence $I$-band light curves collected by The Optical Gravitational Lensing Experiment (OGLE) and fit them to light curves collected in the remaining optical/near-infrared/mid-infrared bands to derive both the variability amplitude ratio and phase-lag as a function of wavelength. We show that the variability amplitude ratio declines with the increasing wavelength for both oxygen-rich (O-rich) and carbon-rich (C-rich) Miras, while the variability phase-lag increases slightly with the increasing wavelength. In a significant number of Miras, mostly the C-rich ones, the spectral energy distributions (SEDs) require a presence of a cool component (dust) in order to match the mid-IR data. Based on SED fits for a golden sample of 140 Miras, we calculated synthetic period-luminosity relations (PLRs) in 42 bands for the existing and future sky surveys that include OGLE, The VISTA Near-Infrared $YJK_\mathrm{s}$ Survey of the Magellanic Clouds System (VMC), Legacy Survey of Space and Time (LSST), Gaia, Spitzer, The Wide-field Infrared Survey Explorer (WISE), The James Webb Space Telescope (JWST), The Nancy Grace Roman Space Telescope (formerly WFIRST), and The Hubble Space Telescope (HST). We show that the synthetic PLR slope decreases with increasing wavelength for both the O-rich and C-rich Miras in the range of 0.1$-$40 microns. Finally, we show the location and motions of Miras on the color-magnitude (CMD) and color-color (CCD) diagrams.
AI Key Findings
Get AI-generated insights about this paper's methodology, results, significance, and more — seven facets brought into focus.
Impact
Paper Details
Authors
PDF Preview
Key Terms
Citation Network
Current paper (gray), citations (green), references (blue)
Display is limited for performance on very large graphs.
Discussion 0