Summary
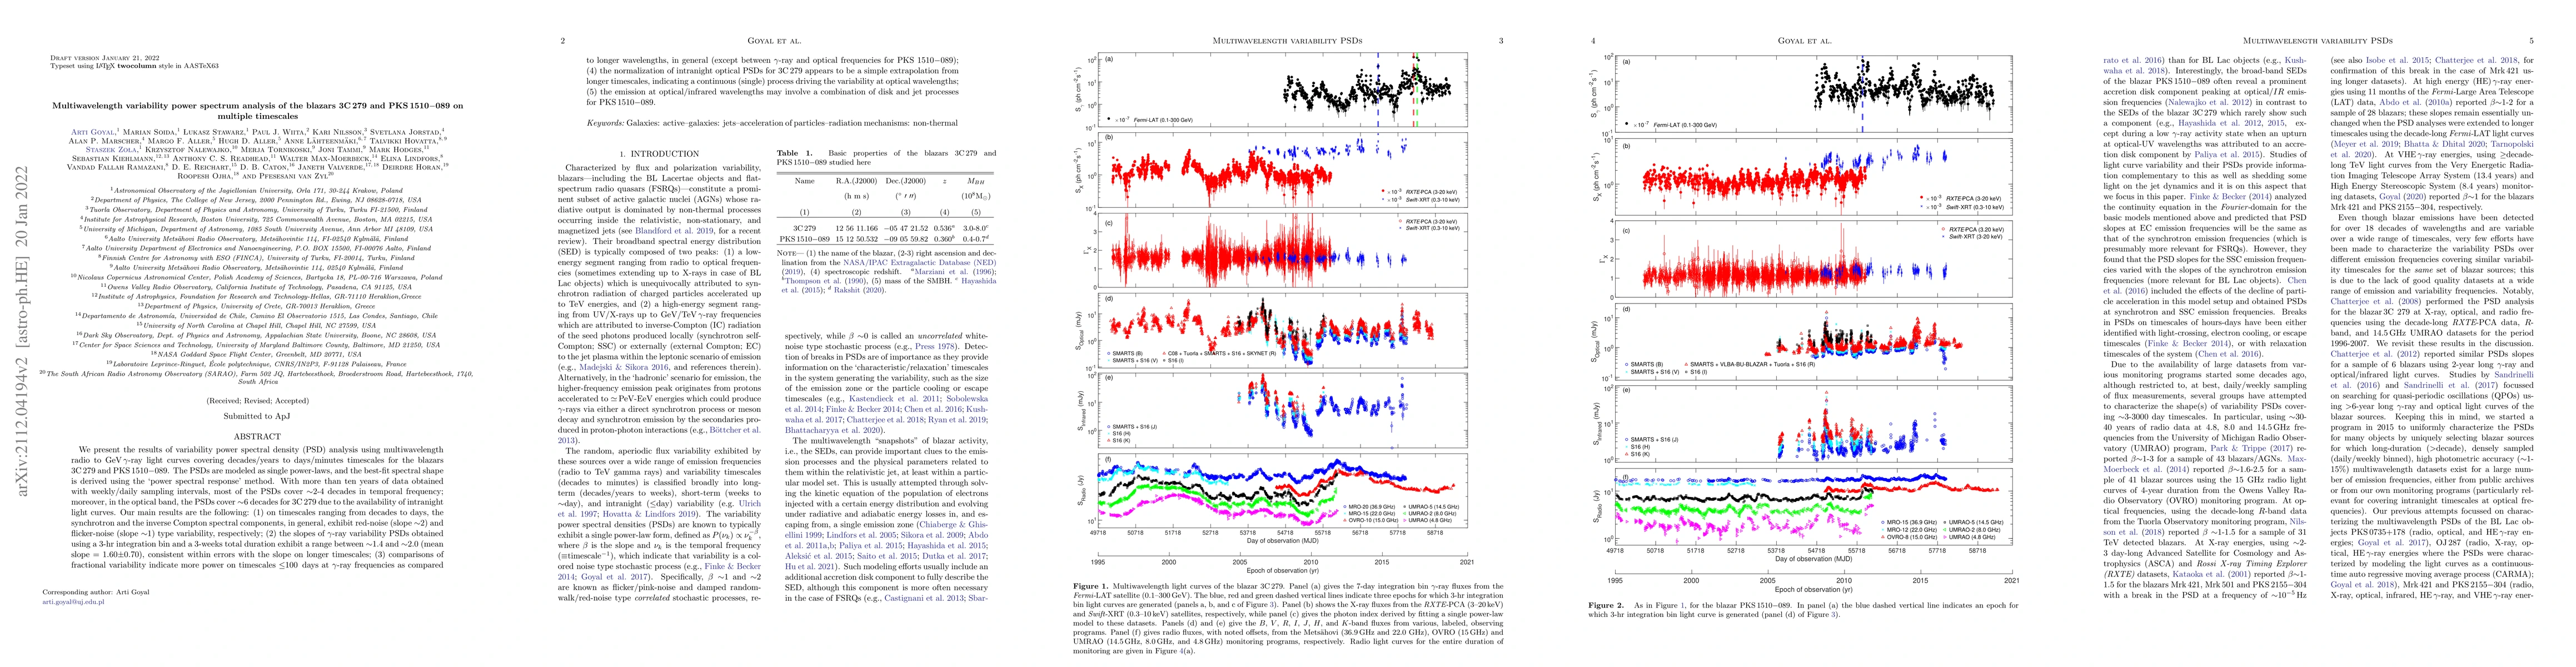
We present the results of variability power spectral density (PSD) analysis using multiwavelength radio to GeV\,$\gamma$-ray light curves covering decades/years to days/minutes timescales for the blazars 3C 279 and PKS 1510-089. The PSDs are modeled as single power-laws, and the best-fit spectral shape is derived using the `power spectral response' method. With more than ten years of data obtained with weekly/daily sampling intervals, most of the PSDs cover ~2-4 decades in temporal frequency; moreover, in the optical band, the PSDs cover ~6 decades for 3C 279 due to the availability of intranight light curves. Our main results are the following: (1) on timescales ranging from decades to days, the synchrotron and the inverse Compton spectral components, in general, exhibit red-noise (slope ~2) and flicker-noise (slope ~1) type variability, respectively; (2) the slopes of $\gamma$-ray variability PSDs obtained using a 3-hr integration bin and a 3-weeks total duration exhibit a range between ~1.4 and ~2.0 (mean slope = 1.60$\pm$0.70), consistent within errors with the slope on longer timescales; (3) comparisons of fractional variability indicate more power on timescales $\leq$100\, days at $\gamma$-ray frequencies as compared to longer wavelengths, in general (except between $\gamma$-ray and optical frequencies for PKS 1510$-$089); (4) the normalization of intranight optical PSDs for 3C\,279 appears to be a simple extrapolation from longer timescales, indicating a continuous (single) process driving the variability at optical wavelengths; (5) the emission at optical/infrared wavelengths may involve a combination of disk and jet processes for PKS\,1510$-$089.
AI Key Findings
Get AI-generated insights about this paper's methodology, results, and significance.
Paper Details
PDF Preview
Key Terms
Citation Network
Current paper (gray), citations (green), references (blue)
Display is limited for performance on very large graphs.
Similar Papers
Found 4 papersOptical Spectropolarimetric Variability Properties in Blazars PKS 0637-75 and PKS 1510-089
Markus Böttcher, Stephanie A. Podjed, Ryan C. Hickox et al.
| Title | Authors | Year | Actions |
|---|
Comments (0)