MuseumViz -- Towards Visualizing Online Museum Collections
Publication
Metrics
Paper Preview
Abstract
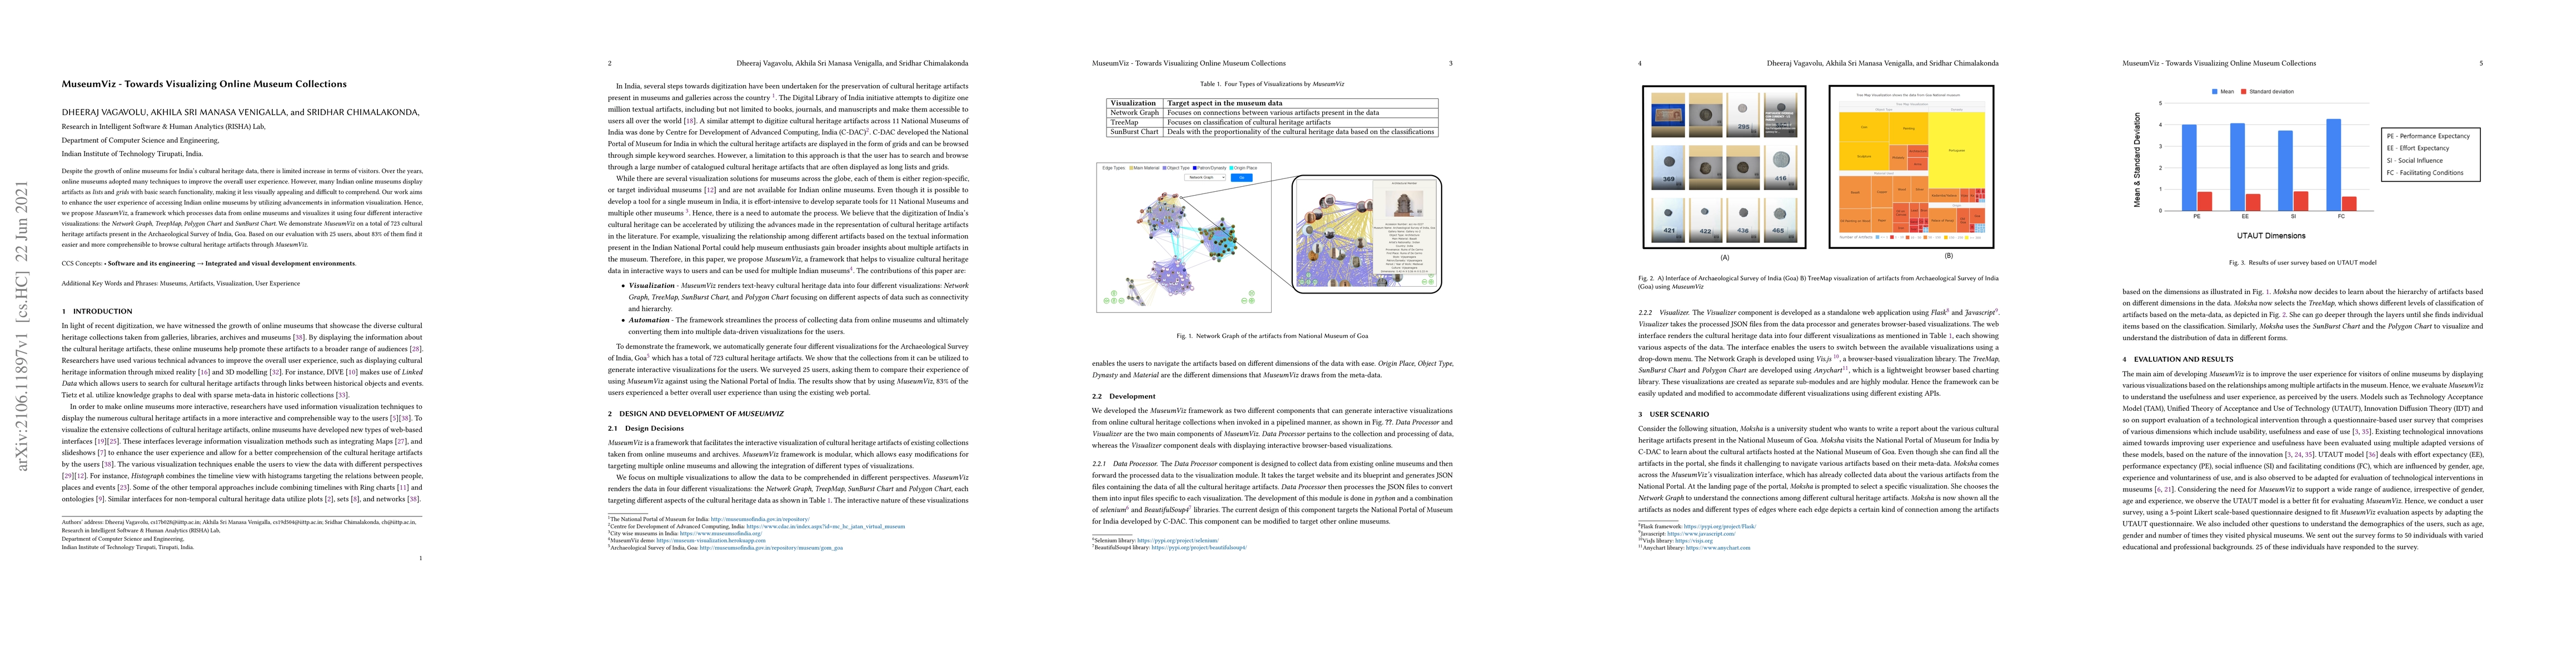
Despite the growth of online museums for India's cultural heritage data, there is limited increase in terms of visitors. Over the years, online museums adopted many techniques to improve the overall user experience. However, many Indian online museums display artifacts as lists and grids with basic search functionality, making it less visually appealing and difficult to comprehend. Our work aims to enhance the user experience of accessing Indian online museums by utilizing advancements in information visualization. Hence, we propose MuseumViz, a framework which processes data from online museums and visualizes it using four different interactive visualizations: the Network Graph, TreepMap, Polygon Chart and SunBurst Chart. We demonstrate MuseumViz on a total of 723 cultural heritage artifacts present in the Archaeological Survey of India, Goa. Based on our evaluation with 25 users, about 83% of them find it easier and more comprehensible to browse cultural heritage artifacts through MuseumViz.
AI Key Findings
Get AI-generated insights about this paper's methodology, results, significance, and more — seven facets brought into focus.
Impact
Paper Details
Authors
PDF Preview
Key Terms
Citation Network
Current paper (gray), citations (green), references (blue)
Display is limited for performance on very large graphs.
Discussion 0