Authors
Summary
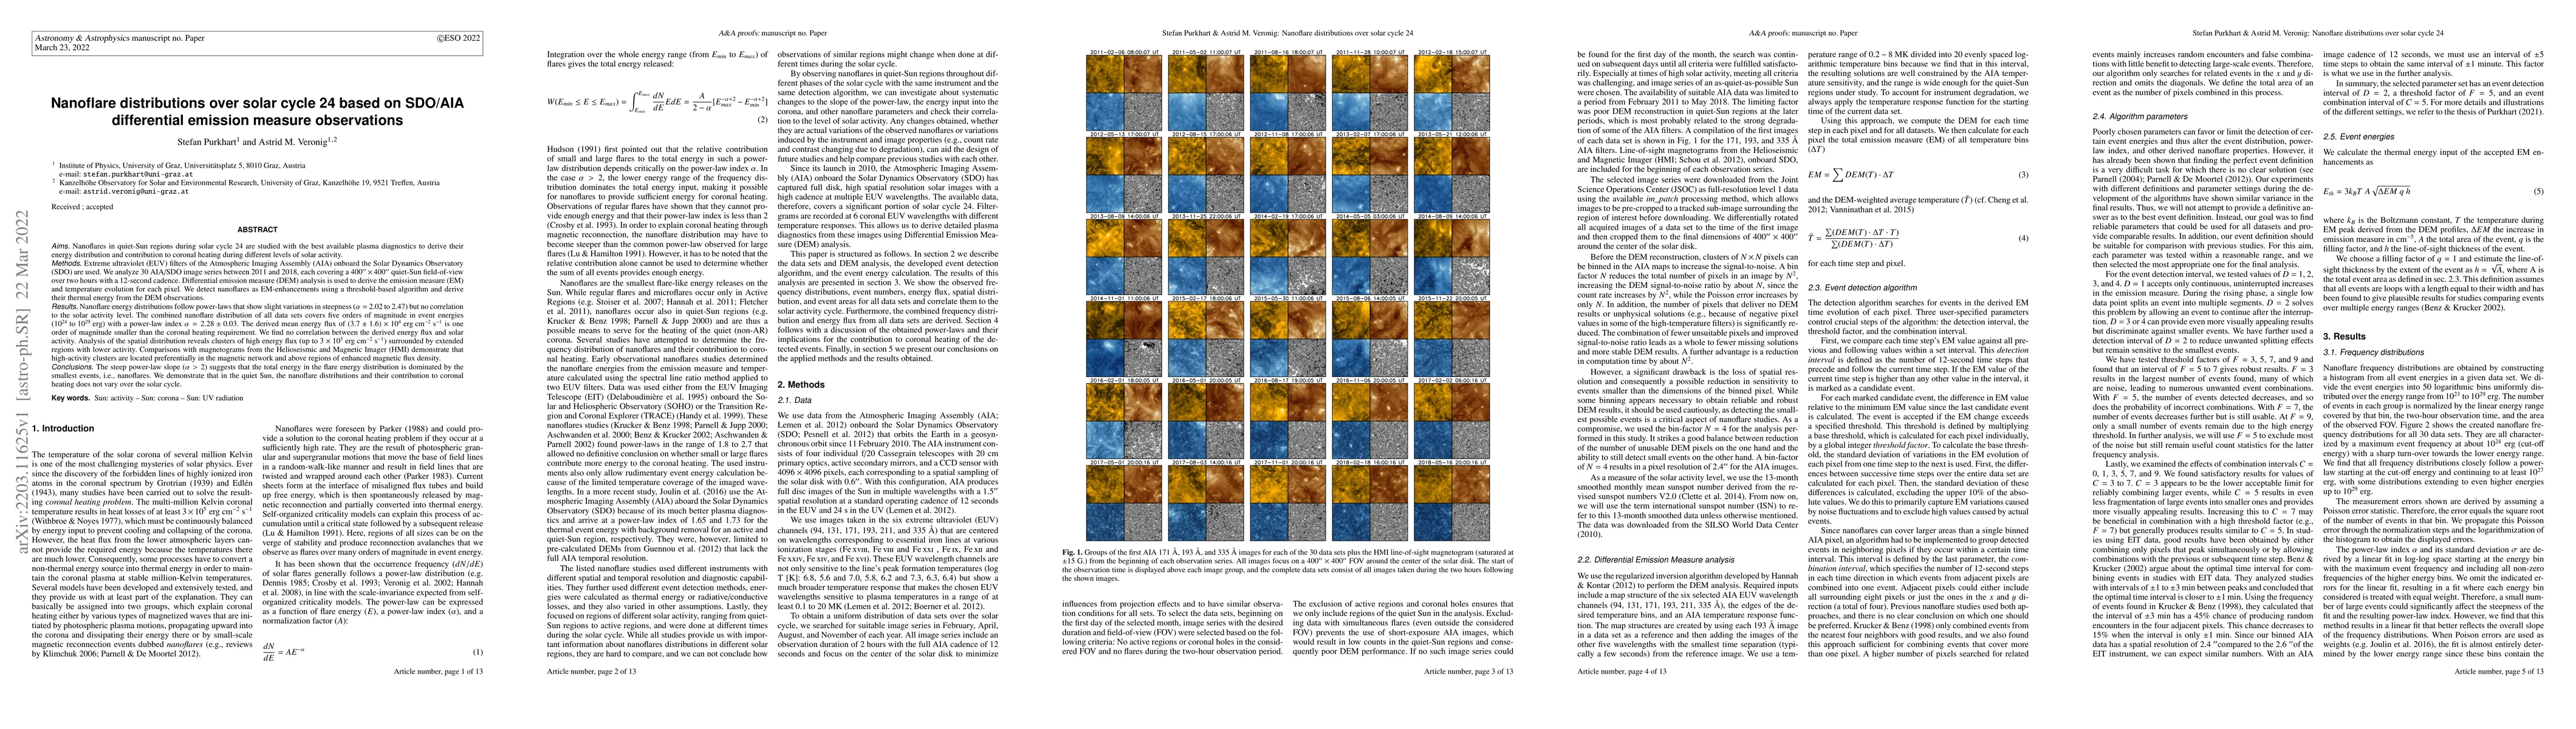
Nanoflares in quiet-Sun regions during solar cycle 24 are studied with the best available plasma diagnostics to derive their energy distribution and contribution to coronal heating during different levels of solar activity. Extreme ultraviolet (EUV) filters of the Atmospheric Imaging Assembly (AIA) onboard the Solar Dynamics Observatory (SDO) are used. We analyze 30 AIA/SDO image series between 2011 and 2018, each covering a $400 \times 400$ arcsec quiet-Sun field-of-view over two hours with a 12-second cadence. Differential emission measure (DEM) analysis is used to derive the emission measure (EM) and temperature evolution for each pixel. We detect nanoflares as EM-enhancements using a threshold-based algorithm and derive their thermal energy from the DEM observations. Nanoflare energy distributions follow power-laws that show slight variations in steepness ($\alpha =$ 2.02 to 2.47) but no correlation to the solar activity level. The combined nanoflare distribution of all data sets covers five orders of magnitude in event energies ($10^{24} \mathrm{~to~} 10^{29} \mathrm{~erg}$) with a power-law index $\alpha=2.28 \pm0.03$. The derived mean energy flux of $(3.7\pm 1.6)\times 10^4\mathrm{~erg~cm^{-2}~s^{-1}}$ is one order of magnitude smaller than the coronal heating requirement. We find no correlation between the derived energy flux and solar activity. Analysis of the spatial distribution reveals clusters of high energy flux (up to $3\times 10^5 \mathrm{~erg~cm^{-2}~s^{-1}}$) surrounded by extended regions with lower activity. Comparisons with magnetograms from the Helioseismic and Magnetic Imager (HMI) demonstrate that high-activity clusters are located preferentially in the magnetic network and above regions of enhanced magnetic flux density.
AI Key Findings
Get AI-generated insights about this paper's methodology, results, and significance.
Paper Details
PDF Preview
Key Terms
Citation Network
Current paper (gray), citations (green), references (blue)
Display is limited for performance on very large graphs.
Similar Papers
Found 4 papers| Title | Authors | Year | Actions |
|---|
Comments (0)