Authors
Summary
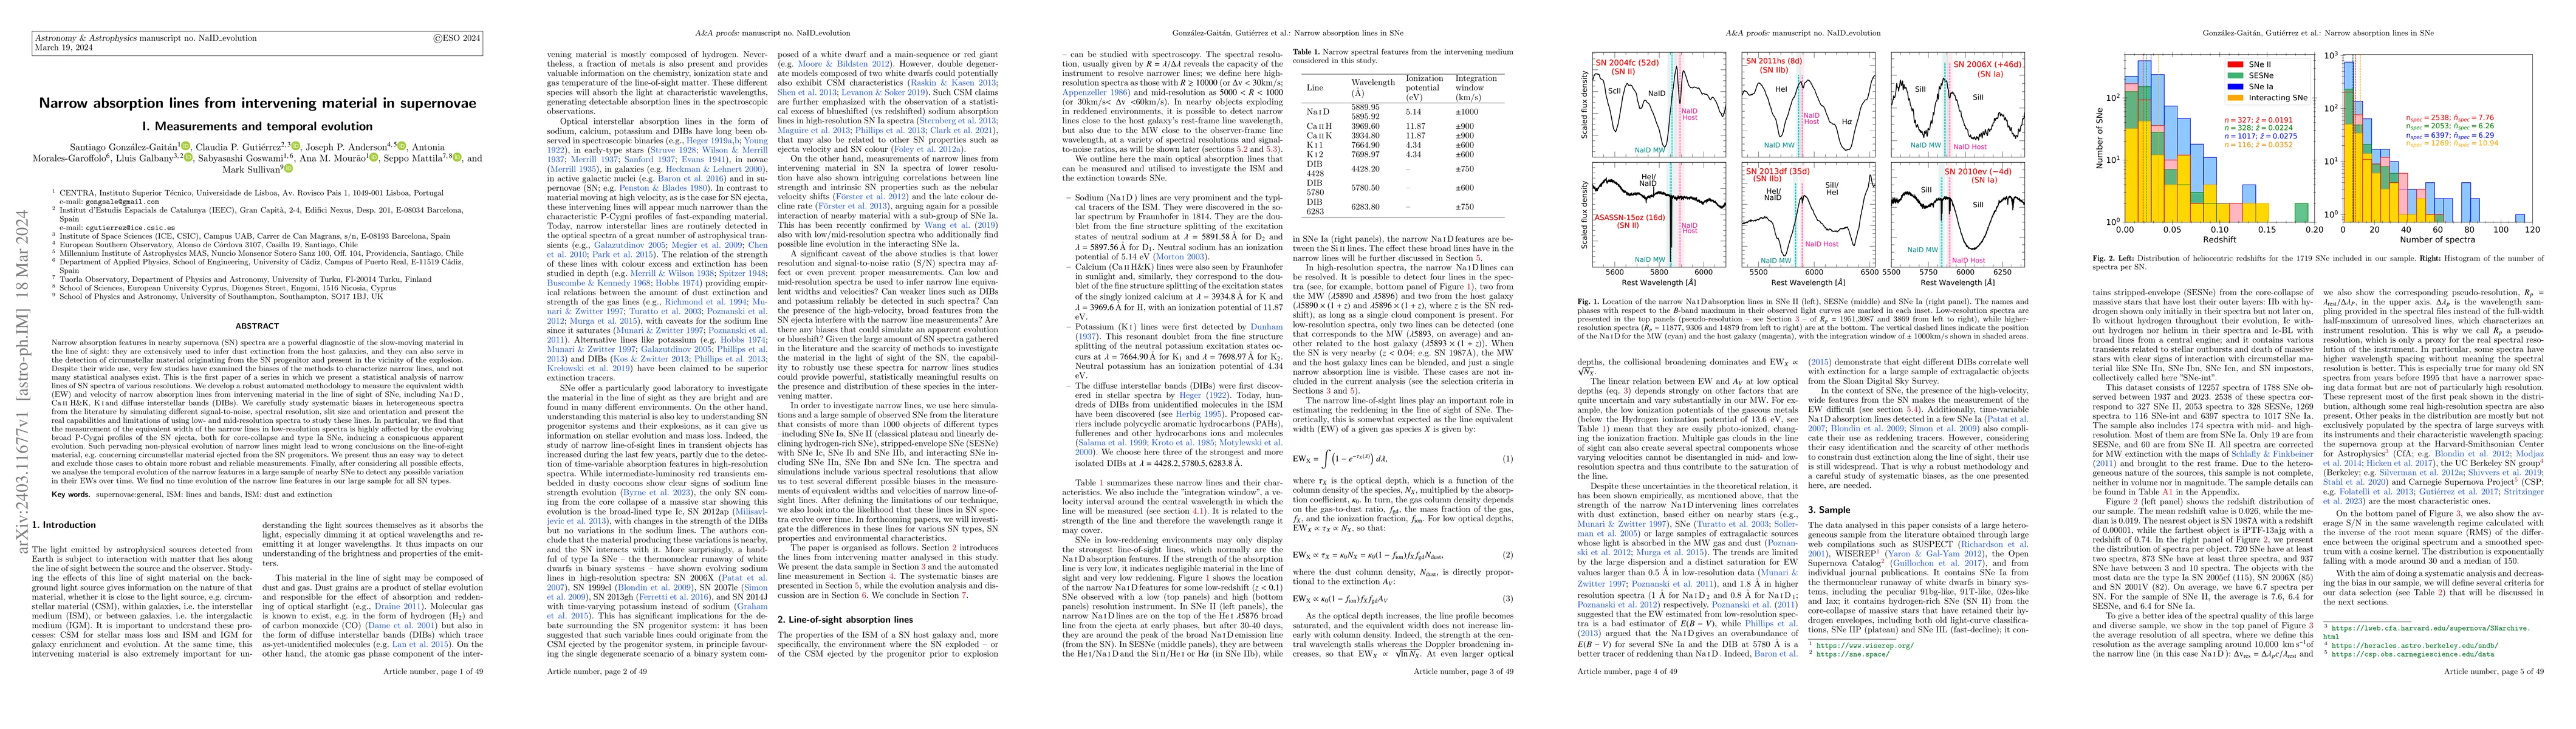
Narrow absorption features in nearby supernova (SN) spectra are a powerful diagnostic of the slow-moving material in the line of sight: they are extensively used to infer dust extinction from the host galaxies, and they can also serve in the detection of circumstellar material originating from the SN progenitor and present in the vicinity of the explosion. Despite their wide use, very few studies have examined the biases of the methods to characterize narrow lines, and not many statistical analyses exist. This is the first paper of a series in which we present a statistical analysis of narrow lines of SN spectra of various resolutions. We develop a robust automated methodology to measure the equivalent width (EW) and velocity of narrow absorption lines from intervening material in the line of sight of SNe, including Na I D , Ca II H&K, K i and diffuse interstellar bands (DIBs). We carefully study systematic biases in heterogeneous spectra from the literature by simulating different signal-to-noise, spectral resolution, slit size and orientation and present the real capabilities and limitations of using low- and mid-resolution spectra to study these lines. In particular, we find that the measurement of the equivalent width of the narrow lines in low-resolution spectra is highly affected by the evolving broad P-Cygni profiles of the SN ejecta, both for core-collapse and type Ia SNe, inducing a conspicuous apparent evolution. We present thus an easy way to detect and exclude those cases to obtain more robust and reliable measurements. Finally, after considering all possible effects, we analyse the temporal evolution of the narrow features in a large sample of nearby SNe to detect any possible variation in their EWs over time. We find no time evolution of the narrow line features in our large sample for all SN types
AI Key Findings
Get AI-generated insights about this paper's methodology, results, and significance.
Paper Details
PDF Preview
Key Terms
Citation Network
Current paper (gray), citations (green), references (blue)
Display is limited for performance on very large graphs.
Similar Papers
Found 4 papersNarrow absorption lines from intervening material in supernovae. II. Galaxy properties
Santiago González-Gaitán, Claudia P. Gutiérrez, Joseph P. Anderson et al.
| Title | Authors | Year | Actions |
|---|
Comments (0)