Summary
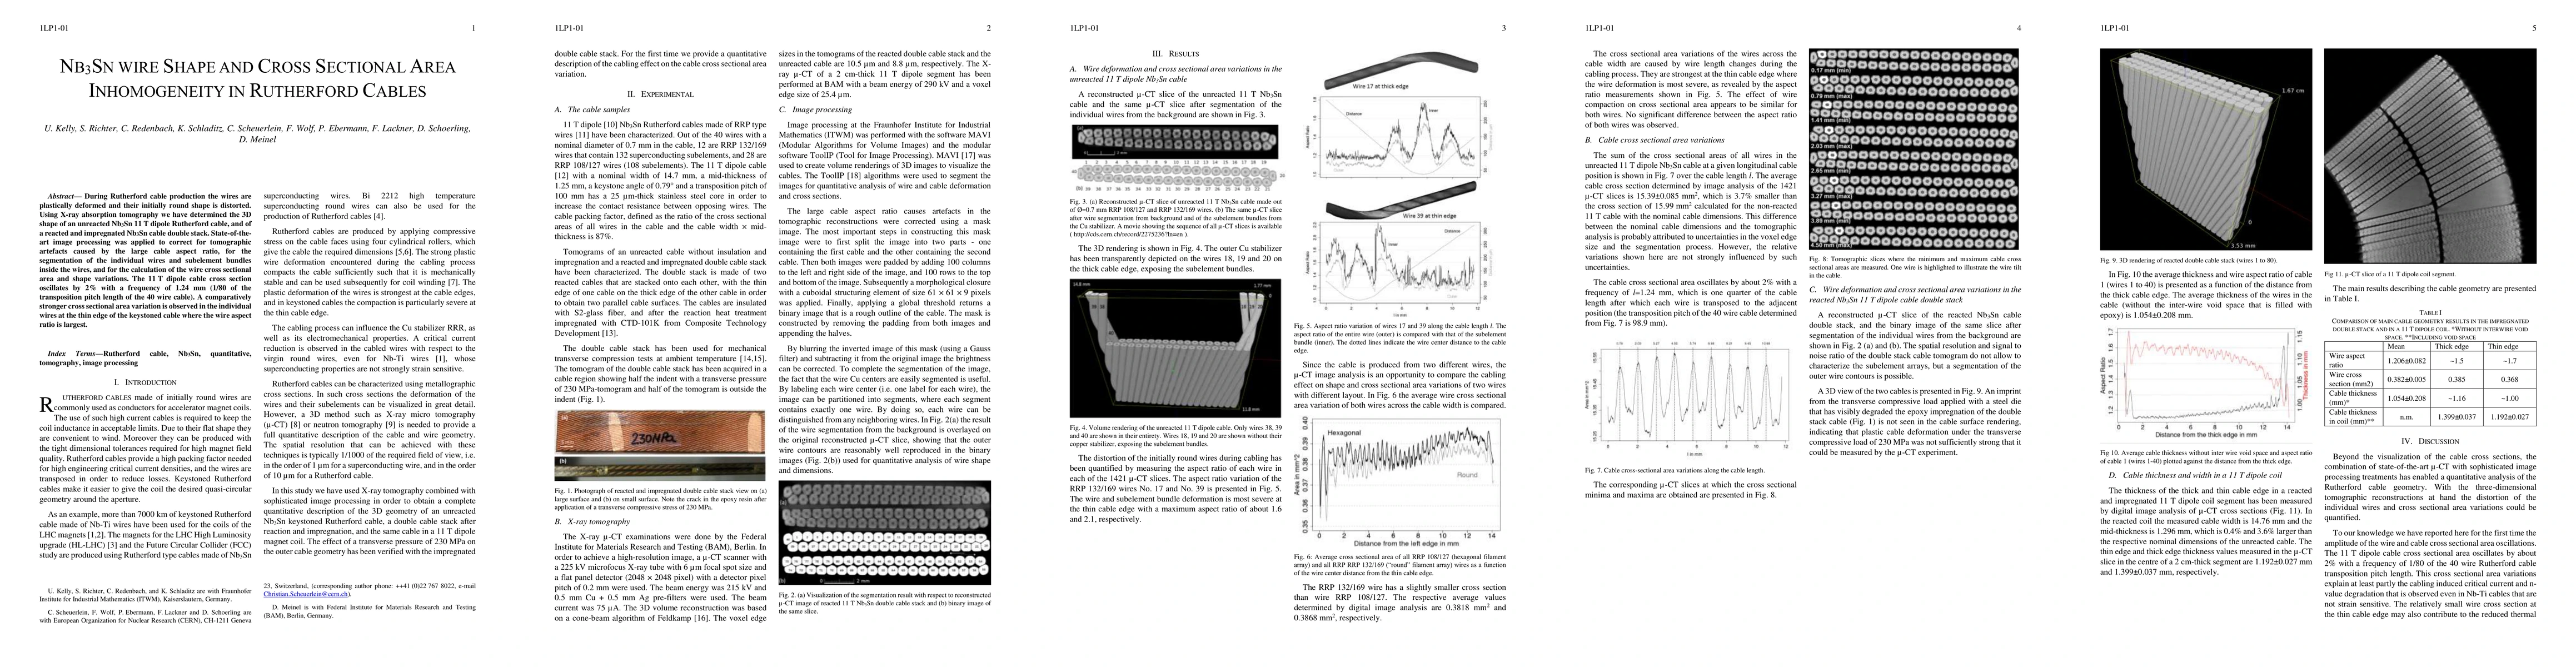
During Rutherford cable production the wires are plastically deformed and their initially round shape is distorted. Using X-ray absorption tomography we have determined the 3D shape of an unreacted Nb3Sn 11 T dipole Rutherford cable, and of a reacted and impregnated Nb3Sn cable double stack. State-of-the-art image processing was applied to correct for tomographic artefacts caused by the large cable aspect ratio, for the segmentation of the individual wires and subelement bundles inside the wires, and for the calculation of the wire cross sectional area and shape variations. The 11 T dipole cable cross section oscillates by 2% with a frequency of 1.24 mm (1/80 of the transposition pitch length of the 40 wire cable). A comparatively stronger cross sectional area variation is observed in the individual wires at the thin edge of the keystoned cable where the wire aspect ratio is largest.
AI Key Findings
Get AI-generated insights about this paper's methodology, results, and significance.
Paper Details
PDF Preview
Key Terms
Citation Network
Current paper (gray), citations (green), references (blue)
Display is limited for performance on very large graphs.
Similar Papers
Found 4 papersImproved training in paraffin-wax impregnated Nb3Sn Rutherford cables demonstrated in BOX samples
Michael Daly, Bernard Auchmann, Anna Kario et al.
Training performance of Nb3Sn Rutherford cables in a channel with a wide range of impregnation materials
S. Sidorov, B. Auchmann, A. Kario et al.
| Title | Authors | Year | Actions |
|---|
Comments (0)