Summary
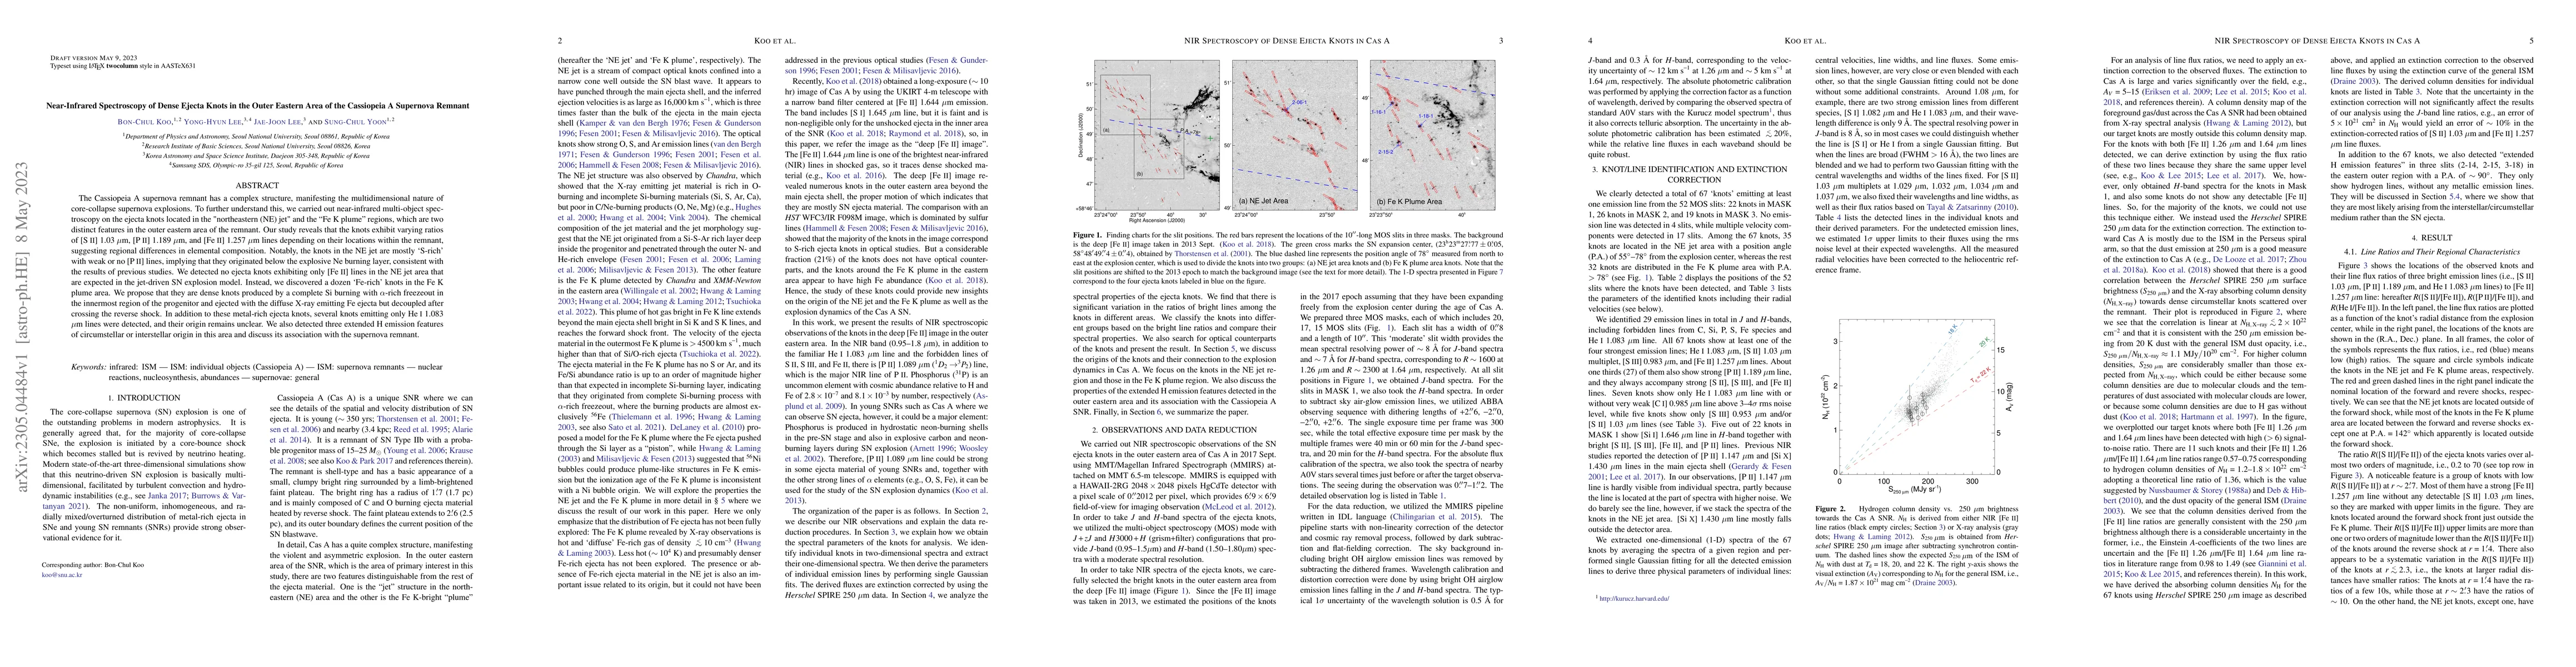
The Cassiopeia A supernova remnant has a complex structure, manifesting the multidimensional nature of core-collapse supernova explosions. To further understand this, we carried out near-infrared multi-object spectroscopy on the ejecta knots located in the "northeastern (NE) jet" and the "Fe K plume" regions, which are two distinct features in the outer eastern area of the remnant. Our study reveals that the knots exhibit varying ratios of [S II] 1.03 $\mu$m, [P II] 1.189 $\mu$m, and [Fe II] 1.257 $\mu$m lines depending on their locations within the remnant, suggesting regional differences in elemental composition. Notably, the knots in the NE jet are mostly 'S-rich' with weak or no [P II] lines, implying that they originated below the explosive Ne burning layer, consistent with the results of previous studies. We detected no ejecta knots exhibiting only [Fe II] lines in the NE jet area that are expected in the jet-driven SN explosion model. Instead, we discovered a dozen 'Fe-rich' knots in the Fe K plume area. We propose that they are dense knots produced by a complete Si burning with $\alpha$-rich freezeout in the innermost region of the progenitor and ejected with the diffuse X-ray emitting Fe ejecta but decoupled after crossing the reverse shock. In addition to these metal-rich ejecta knots, several knots emitting only He I 1.083 $\mu$m lines were detected, and their origin remains unclear. We also detected three extended H emission features of circumstellar or interstellar origin in this area and discuss its association with the supernova remnant.
AI Key Findings
Get AI-generated insights about this paper's methodology, results, and significance.
Paper Details
PDF Preview
Key Terms
Citation Network
Current paper (gray), citations (green), references (blue)
Display is limited for performance on very large graphs.
Similar Papers
Found 4 papers| Title | Authors | Year | Actions |
|---|
Comments (0)