NEOMOD 3: The Debiased Size Distribution of Near Earth Objects
Publication
Metrics
AI Quick Summary
NEOMOD3 refines NEOMOD2 by incorporating visible albedo data, revealing smaller NEOs tend to have higher albedos on average. The model estimates 830±60 NEOs larger than 1 km and 20,000±2,000 NEOs larger than 140 m, and is accessible via the NEOMOD Simulator for customized data generation.
Paper Preview
Abstract
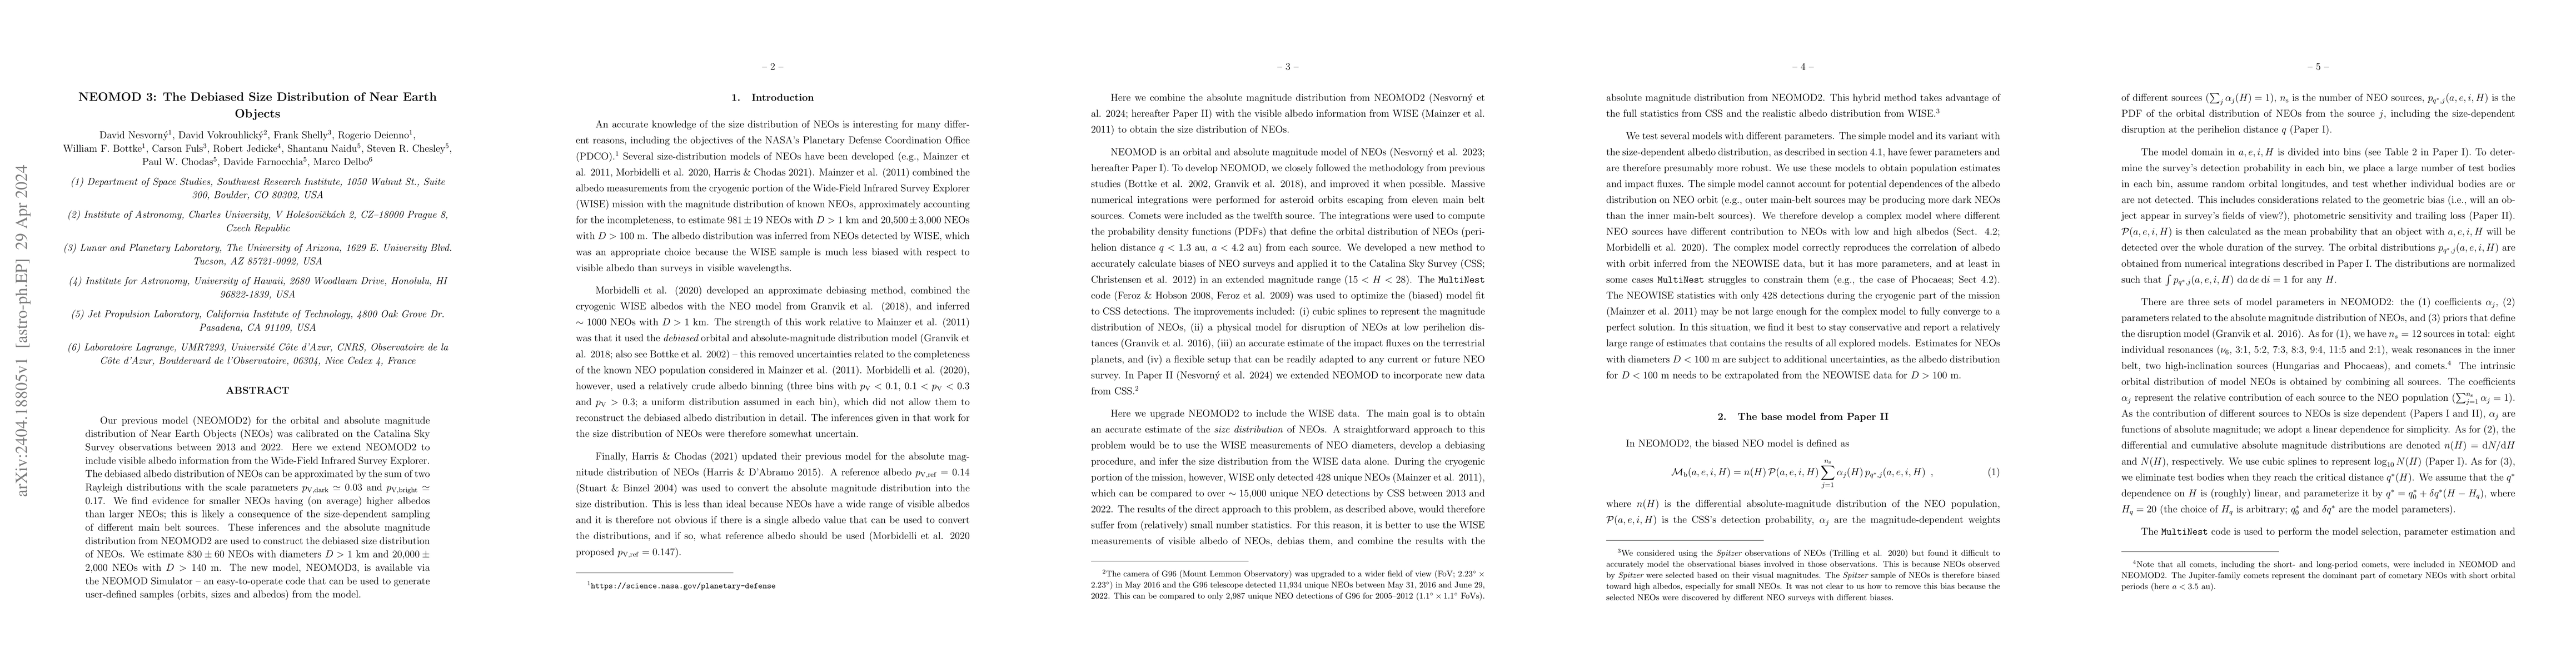
Our previous model (NEOMOD2) for the orbital and absolute magnitude distribution of Near Earth Objects (NEOs) was calibrated on the Catalina Sky Survey observations between 2013 and 2022. Here we extend NEOMOD2 to include visible albedo information from the Wide-Field Infrared Survey Explorer. The debiased albedo distribution of NEOs can be approximated by the sum of two Rayleigh distributions with the scale parameters p_V,dark=0.03 and p_V,bright=0.17. We find evidence for smaller NEOs having (on average) higher albedos than larger NEOs; this is likely a consequence of the size-dependent sampling of different main belt sources. These inferences and the absolute magnitude distribution from NEOMOD2 are used to construct the debiased size distribution of NEOs. We estimate 830+/-60 NEOs with diameters D>1 km and 20,000+/-2,000 NEOs with D>140 m. The new model, NEOMOD3, is available via the NEOMOD Simulator -- an easy-to-operate code that can be used to generate user-defined samples (orbits, sizes and albedos) from the model.
AI Key Findings
Get AI-generated insights about this paper's methodology, results, significance, and more — seven facets brought into focus.
Impact
Paper Details
Authors
PDF Preview
Key Terms
Citation Network
Current paper (gray), citations (green), references (blue)
Display is limited for performance on very large graphs.
Discussion 0