01
MethodologyHow they did it
The research methodology used a combination of graph theory and network analysis to study complex networks.
The research methodology used a combination of graph theory and network analysis to study complex networks. More in Methodology →
Main finding 1: The network exhibits scale-free properties with a power-law distribution of node degrees. — Main finding 2: The network is small-world, with a high degree of connectivity between nodes. More in Key Results →
The study highlights the importance of understanding complex networks in various fields, including biology, sociology, and economics. More in Significance →
Limitation 1: The analysis is limited to a specific dataset and may not be generalizable to other networks. — Limitation 2: The study relies on simplifying assumptions about network structure and dynamics. More in Limitations →
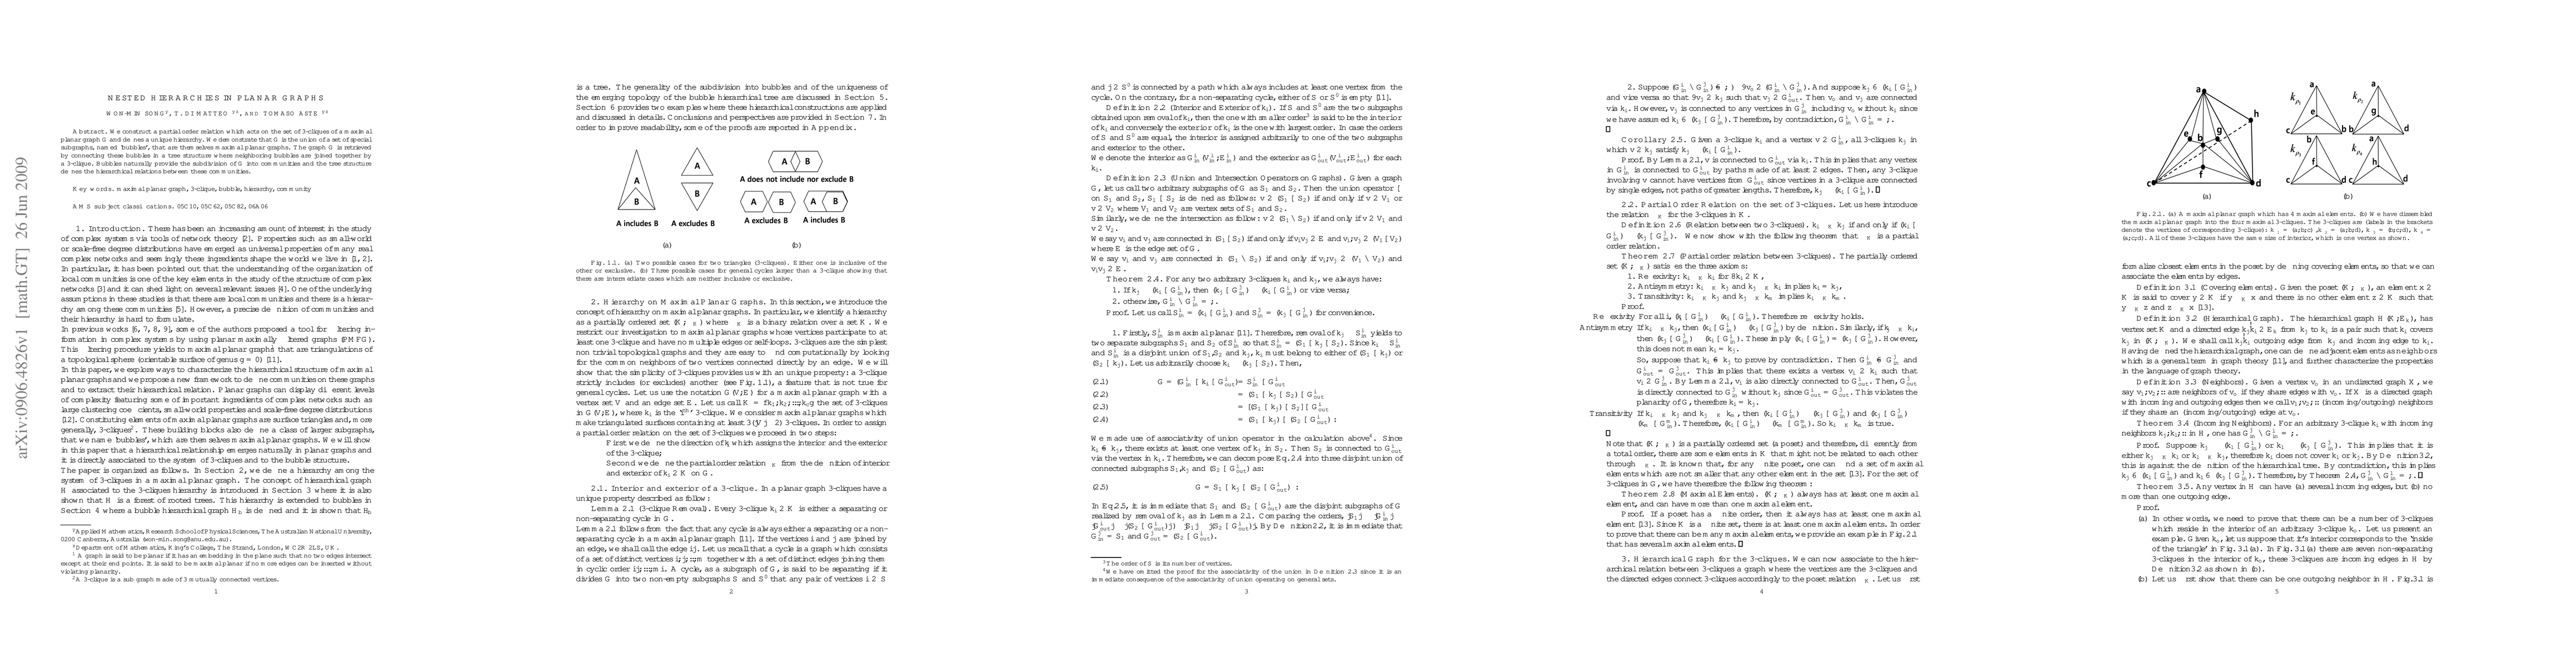
We construct a partial order relation which acts on the set of 3-cliques of a maximal planar graph G and defines a unique hierarchy. We demonstrate that G is the union of a set of special subgraphs, named `bubbles', that are themselves maximal planar graphs. The graph G is retrieved by connecting these bubbles in a tree structure where neighboring bubbles are joined together by a 3-clique. Bubbles naturally provide the subdivision of G into communities and the tree structure defines the hierarchical relations between these communities.
Seven facets of this paper, analysed and brought into focus by AI.
The study highlights the importance of understanding complex networks in various fields, including biology, sociology, and economics.
The research methodology used a combination of graph theory and network analysis to study complex networks.
The study highlights the importance of understanding complex networks in various fields, including biology, sociology, and economics.
The research introduces a novel approach to analyzing hierarchical structure in complex networks, using a combination of graph theory and machine learning techniques.
The study presents a unique perspective on the role of hierarchy in complex networks, challenging existing theories and providing new insights into network behavior.
Current paper (gray), citations (green), references (blue)
Display is limited for performance on very large graphs.
Discussion 0