Summary
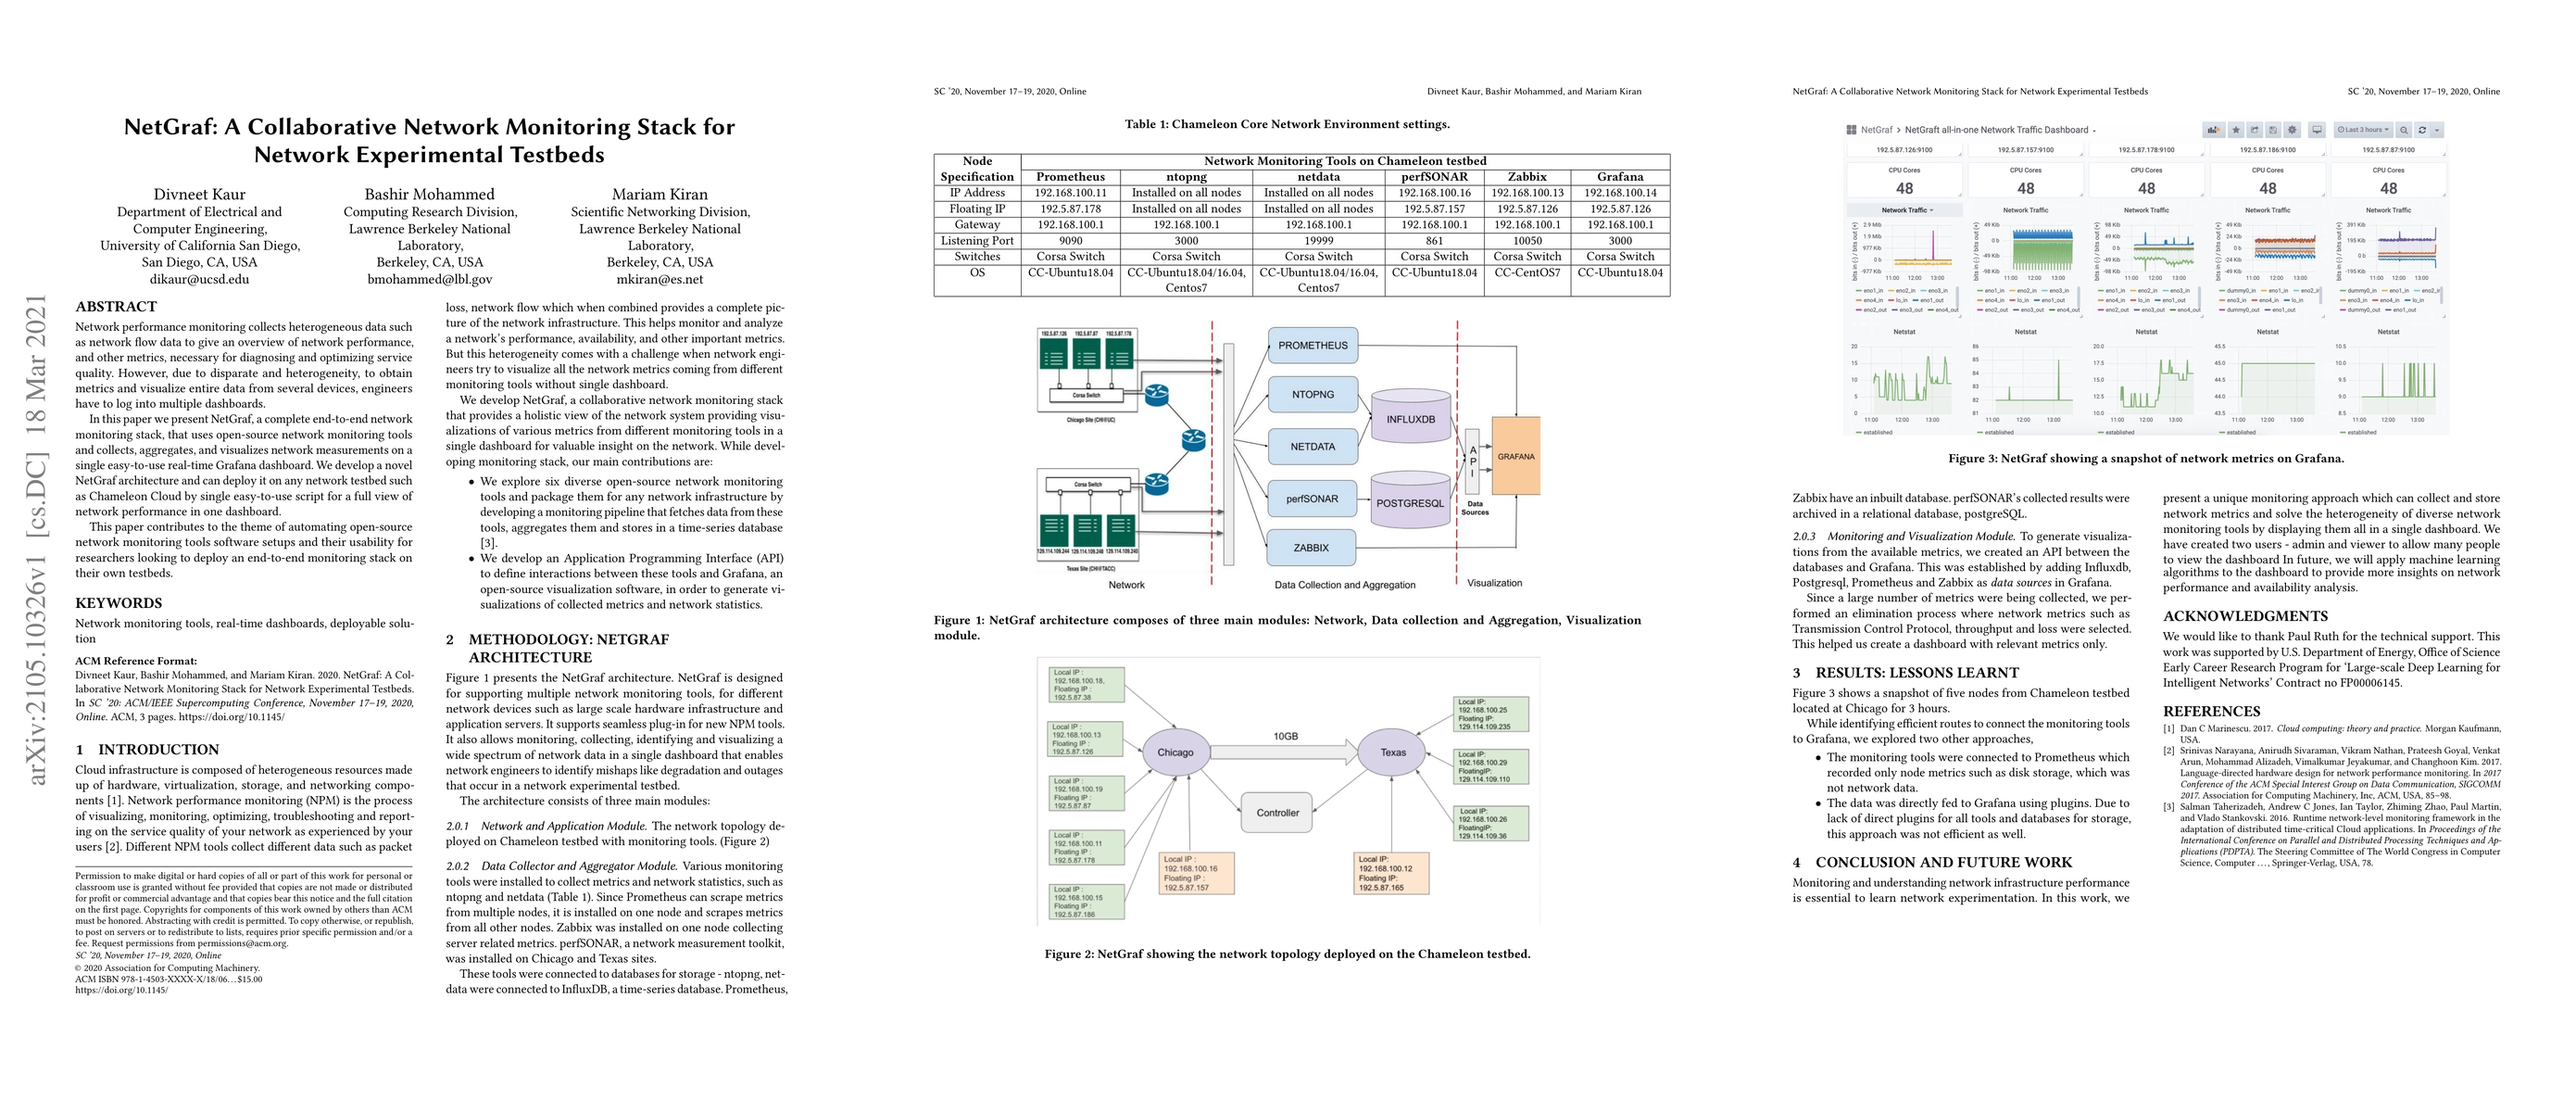
Network performance monitoring collects heterogeneous data suchas network flow data to give an overview of network performance,and other metrics, necessary for diagnosing and optimizing servicequality. However, due to disparate and heterogeneity, to obtainmetrics and visualize entire data from several devices, engineershave to log into multiple dashboards.In this paper we present NetGraf, a complete end-to-end networkmonitoring stack, that uses open-source network monitoring toolsand collects, aggregates, and visualizes network measurements on asingle easy-to-use real-time Grafana dashboard. We develop a novelNetGraf architecture and can deploy it on any network testbed suchas Chameleon Cloud by single easy-to-use script for a full view ofnetwork performance in one dashboard.This paper contributes to the theme of automating open-sourcenetwork monitoring tools software setups and their usability forresearchers looking to deploy an end-to-end monitoring stack ontheir own testbeds.
AI Key Findings
Get AI-generated insights about this paper's methodology, results, and significance.
Paper Details
PDF Preview
Key Terms
Citation Network
Current paper (gray), citations (green), references (blue)
Display is limited for performance on very large graphs.
Similar Papers
Found 4 papersBeehive: A Flexible Network Stack for Direct-Attached Accelerators
Katie Lim, Baris Kasikci, Matthew Giordano et al.
| Title | Authors | Year | Actions |
|---|

Comments (0)