Network Analysis of Urban Traffic with Big Bus Data

Source: ArXiv

AI Quick Summary

This paper analyzes urban traffic in Helsinki using network and statistical methods based on a large bus dataset. It identifies key traffic-causing areas using betweenness centrality and finds that bus traffic is not a major cause of urban traffic. Recommendations include adding more buses during peak times and optimizing bus schedules in high-traffic zones to improve urban traffic systems.

Share: Share on X LinkedIn

Summary

Urban traffic analysis is crucial for traffic forecasting systems, urban planning and, more recently, various mobile and network applications. In this paper, we analyse urban traffic with network and statistical methods. Our analysis is based on one big bus dataset containing 45 million bus arrival samples in Helsinki. We mainly address following questions: 1. How can we identify the areas that cause most of the traffic in the city? 2. Why there is a urban traffic? Is bus traffic a key cause of the urban traffic? 3. How can we improve the urban traffic systems? To answer these questions, first, the betweenness is used to identify the most import areas that cause most traffics. Second, we find that bus traffic is not an important cause of urban traffic using statistical methods. We differentiate the urban traffic and the bus traffic in a city. We use bus delay as an identification of the urban traffic, and the number of bus as an identification of the bus traffic. Third, we give our solutions on how to improve urban traffic by the traffic simulation on road networks. We show that adding more buses during the peak time and providing better bus schedule plan in the hot areas like railway station, metro station, shopping malls etc. will reduce the urban traffic.
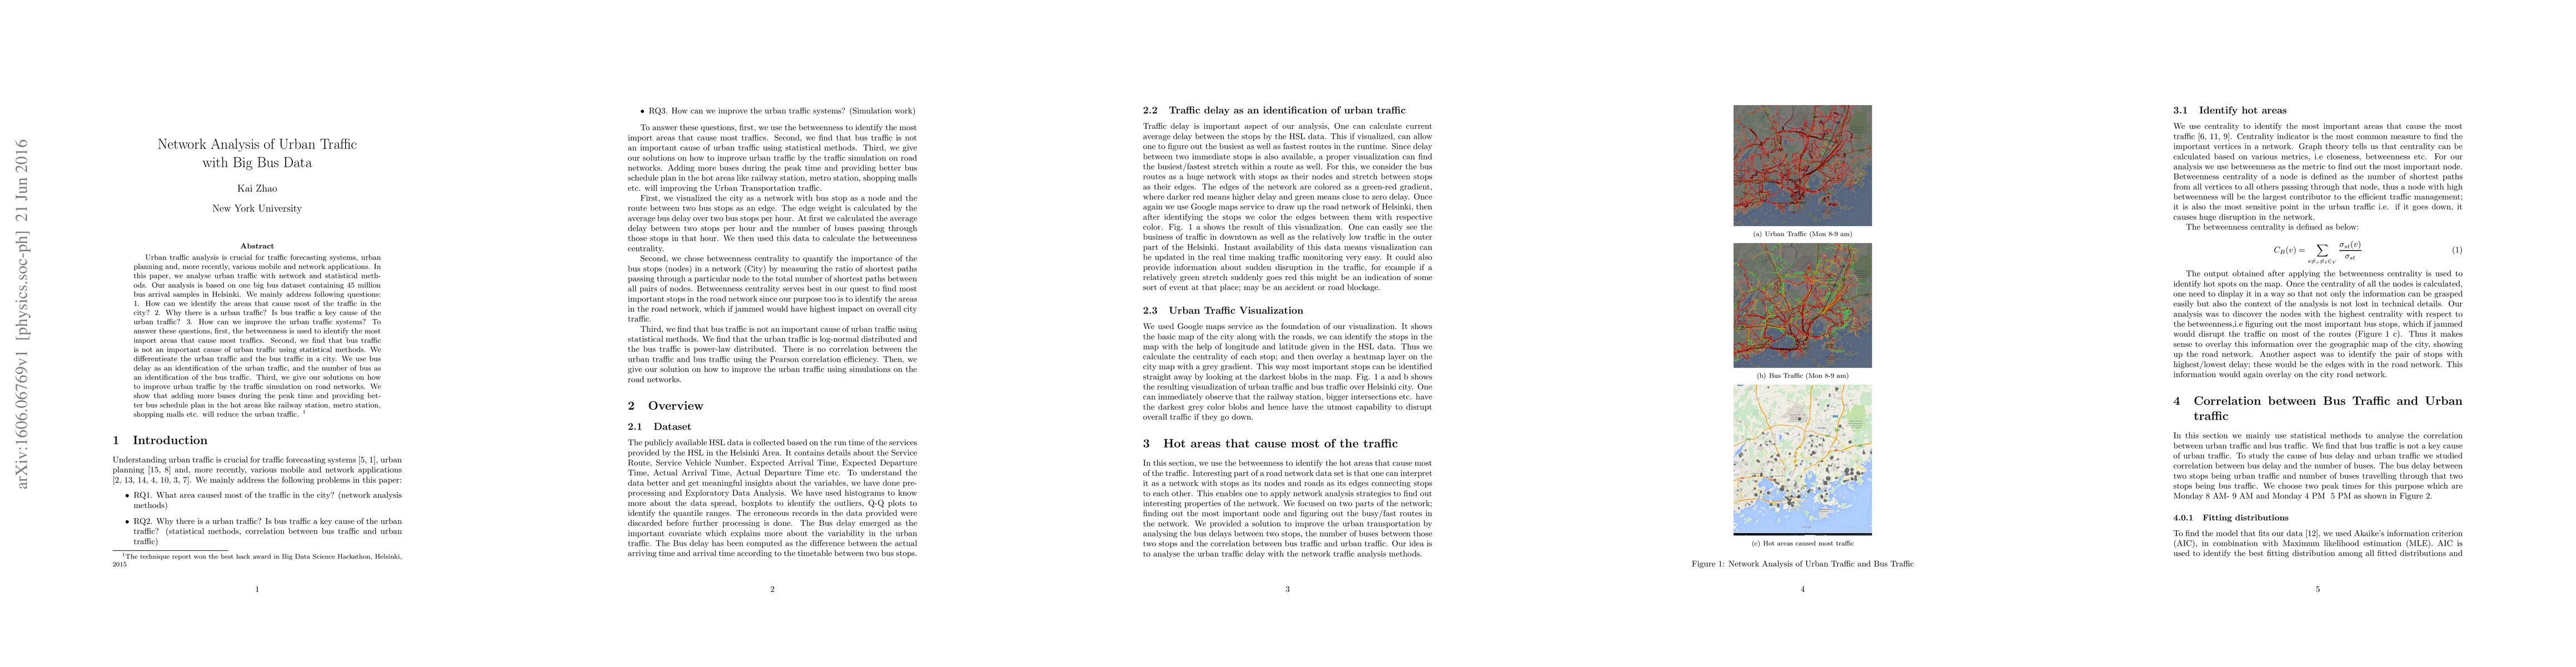
AI Key Findings

Generated Sep 02, 2025

Methodology

The research analyses urban traffic using network and statistical methods based on a big bus dataset containing 45 million bus arrival samples in Helsinki. It employs betweenness to identify important areas causing most traffic, differentiates urban traffic from bus traffic, and uses traffic simulation on road networks to propose improvements.

Key Results

  • Bus traffic is not a significant cause of urban traffic.
  • Most important bus stops causing traffic disruptions can be identified using betweenness centrality.
  • Adding more buses during peak times and providing better bus schedules in hot areas (railway stations, metro stations, shopping malls) can improve urban traffic systems.
  • Urban traffic delay and bus traffic follow log-normal and power-law distributions, respectively, with no significant correlation between them.

Significance

This research is important for urban planning, traffic forecasting systems, and mobile/network applications by providing insights into the causes of urban traffic and suggesting solutions to improve urban transportation systems.

Technical Contribution

The paper presents a novel approach to urban traffic analysis using network and statistical methods, differentiating between urban traffic and bus traffic, and proposing solutions based on traffic simulations.

Novelty

The research distinguishes itself by employing betweenness centrality to identify critical bus stops causing urban traffic disruptions and by demonstrating that bus traffic is not a key cause of urban traffic, challenging previous assumptions.

Limitations

  • The study is limited to Helsinki's bus data and may not be generalizable to other cities without similar datasets.
  • The analysis does not consider other factors influencing urban traffic, such as private vehicle usage or road construction.

Future Work

  • Investigate the applicability of the findings in other urban areas with diverse traffic patterns and datasets.
  • Explore additional factors contributing to urban traffic congestion and their interactions with public bus traffic.

Paper Details

PDF Preview

Download PDF

Key Terms

urban (0.427)
traffic (0.420)
traffic (0.420)
urban (0.418)
cause (0.258)
cause (0.233)
areas (0.222)
city (0.219)

Citation Network

Current paper (gray), citations (green), references (blue)

Display is limited for performance on very large graphs.

Current Paper
Citations
References
Click to view
Title Authors Year Actions

Comments (0)

This website uses cookies to ensure you get the best experience. Learn more