Authors
Summary
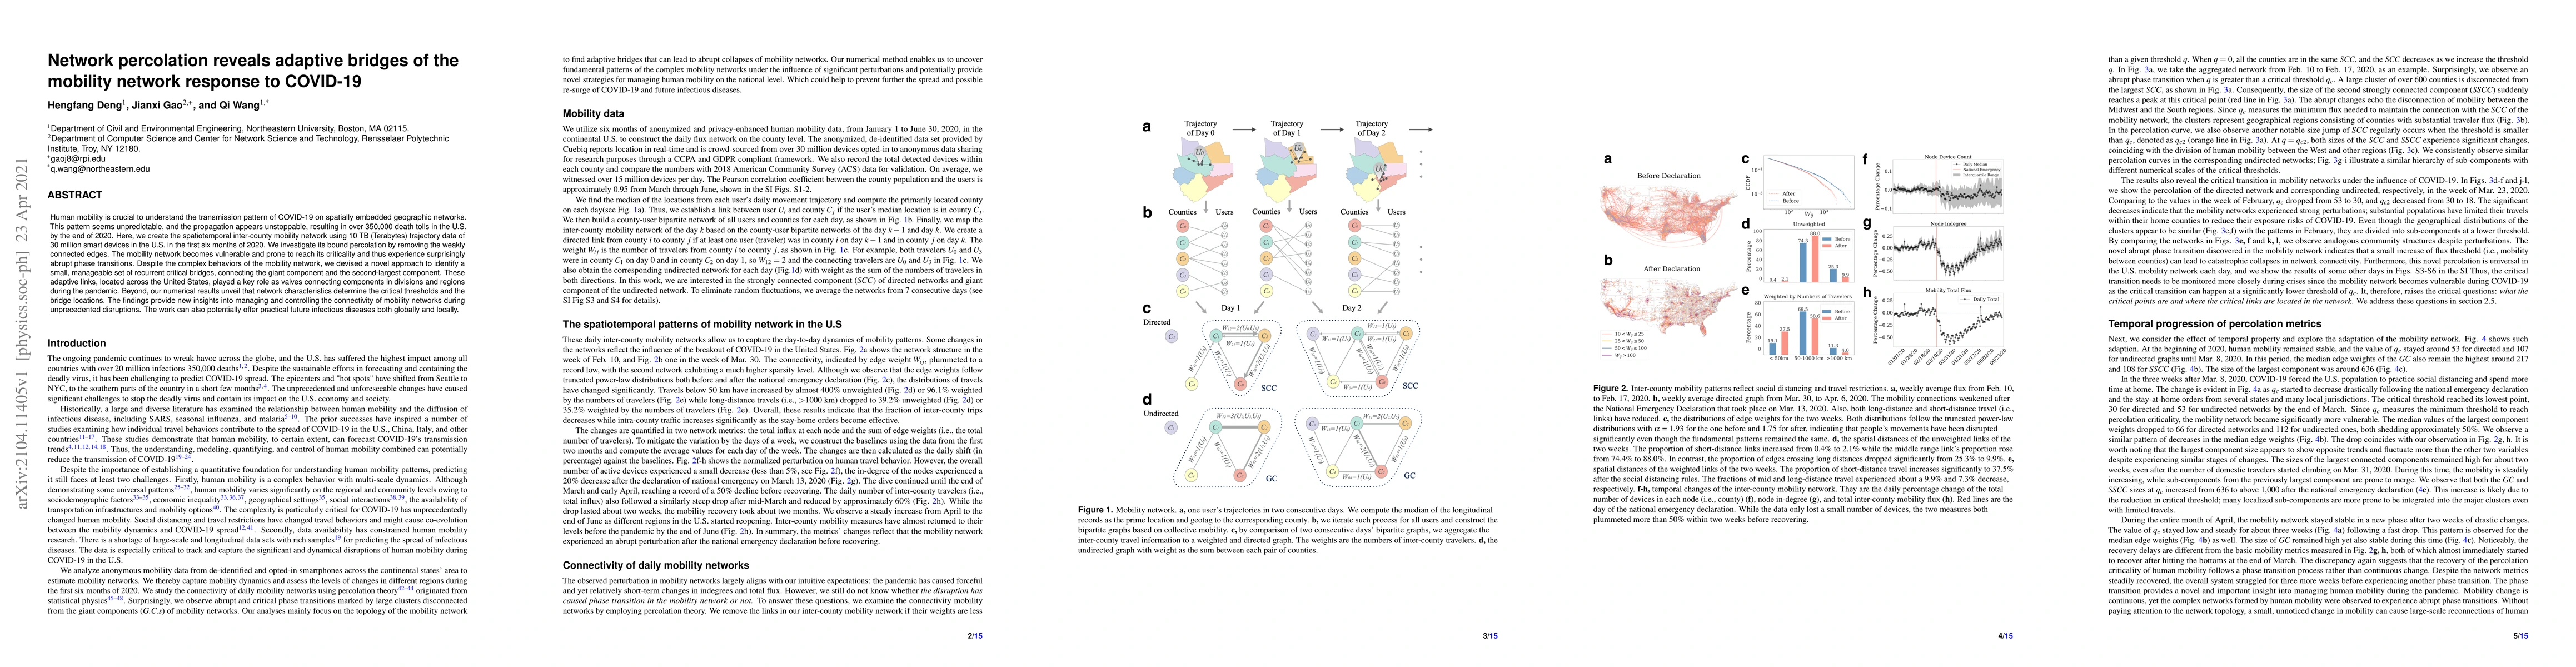
Human mobility is crucial to understand the transmission pattern of COVID-19 on spatially embedded geographic networks. This pattern seems unpredictable, and the propagation appears unstoppable, resulting in over 350,000 death tolls in the U.S. by the end of 2020. Here, we create the spatiotemporal inter-county mobility network using 10 TB (Terabytes) trajectory data of 30 million smart devices in the U.S. in the first six months of 2020. We investigate its bound percolation by removing the weakly connected edges. The mobility network becomes vulnerable and prone to reach its criticality and thus experience surprisingly abrupt phase transitions. Despite the complex behaviors of the mobility network, we devised a novel approach to identify a small, manageable set of recurrent critical bridges, connecting the giant component and the second-largest component. These adaptive links, located across the United States, played a key role as valves connecting components in divisions and regions during the pandemic. Beyond, our numerical results unveil that network characteristics determine the critical thresholds and the bridge locations. The findings provide new insights into managing and controlling the connectivity of mobility networks during unprecedented disruptions. The work can also potentially offer practical future infectious diseases both globally and locally.
AI Key Findings
Get AI-generated insights about this paper's methodology, results, and significance.
Paper Details
PDF Preview
Key Terms
Citation Network
Current paper (gray), citations (green), references (blue)
Display is limited for performance on very large graphs.
Similar Papers
Found 4 papersResilience of mobility network to dynamic population response across COVID-19 interventions: evidences from Chile
Kyriaki Kalimeri, Mattia Mazzoli, Rossano Schifanella et al.
| Title | Authors | Year | Actions |
|---|
Comments (0)