Publication
Metrics
AI Quick Summary
Neural Graphical Models (NGMs) use neural networks to represent complex feature dependencies efficiently, overcoming computational limitations of traditional probabilistic graphical models. NGMs provide effective learning, inference, and sampling algorithms, and are empirically shown to perform well on Gaussian graphical models, lung cancer data, and infant mortality data.
Paper Preview
Abstract
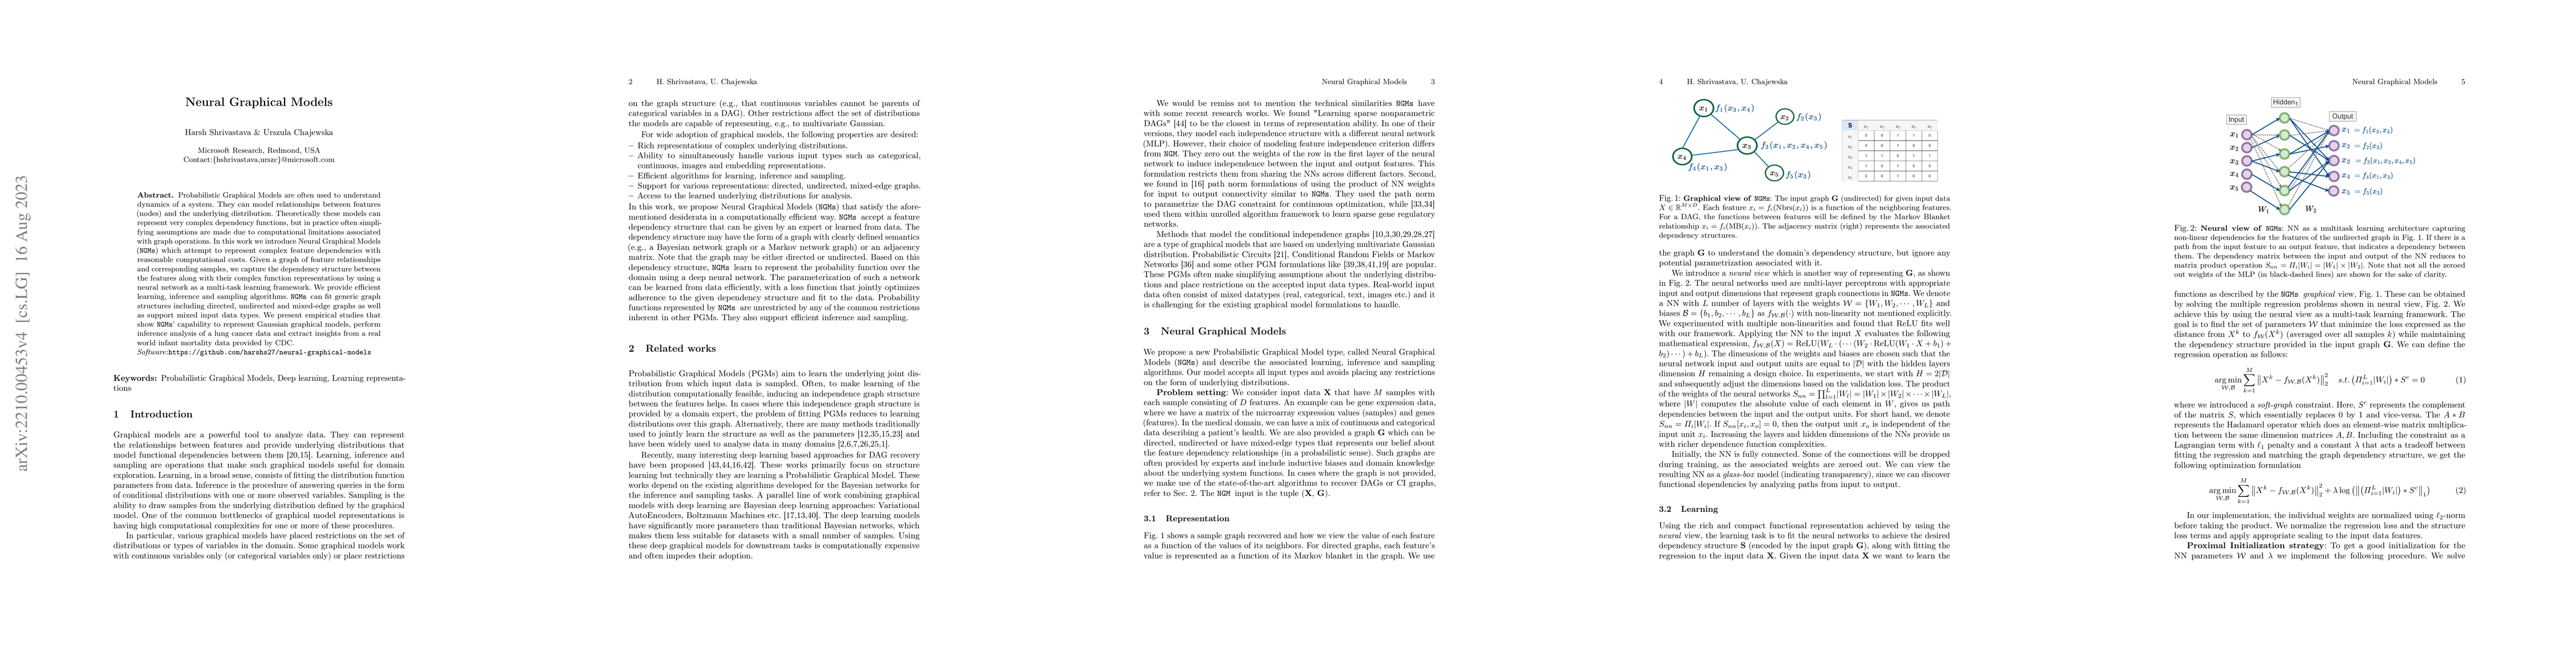
Probabilistic Graphical Models are often used to understand dynamics of a system. They can model relationships between features (nodes) and the underlying distribution. Theoretically these models can represent very complex dependency functions, but in practice often simplifying assumptions are made due to computational limitations associated with graph operations. In this work we introduce Neural Graphical Models (NGMs) which attempt to represent complex feature dependencies with reasonable computational costs. Given a graph of feature relationships and corresponding samples, we capture the dependency structure between the features along with their complex function representations by using a neural network as a multi-task learning framework. We provide efficient learning, inference and sampling algorithms. NGMs can fit generic graph structures including directed, undirected and mixed-edge graphs as well as support mixed input data types. We present empirical studies that show NGMs' capability to represent Gaussian graphical models, perform inference analysis of a lung cancer data and extract insights from a real world infant mortality data provided by Centers for Disease Control and Prevention.
AI Key Findings
Get AI-generated insights about this paper's methodology, results, significance, and more — seven facets brought into focus.
Impact
Paper Details
Authors
PDF Preview
Key Terms
Citation Network
Current paper (gray), citations (green), references (blue)
Display is limited for performance on very large graphs.
Discussion 0