Publication
Metrics
AI Quick Summary
This paper introduces a new grid of ATLAS9 and MARCS model photospheres for the APOGEE survey, featuring improved opacity functions and a broader metallicity and carbon abundance range. The models are publicly available and cover a wide range of stellar temperatures and gravities.
Paper Preview
Abstract
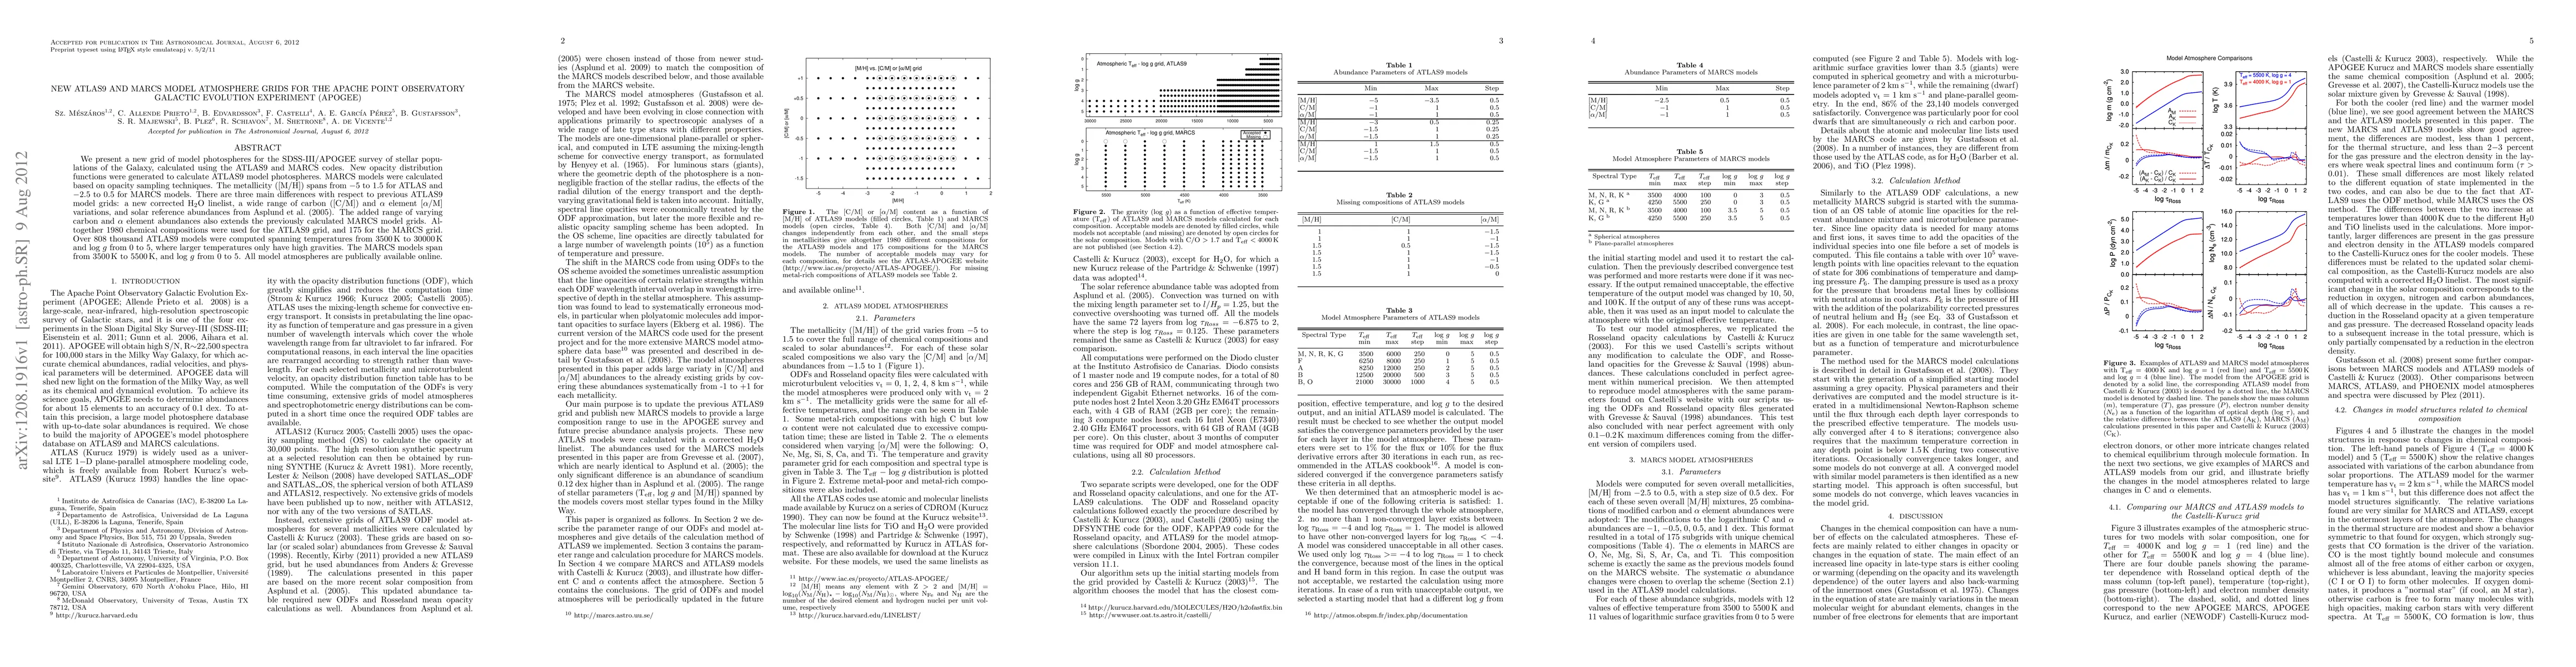
We present a new grid of model photospheres for the SDSS-III/APOGEE survey of stellar populations of the Galaxy, calculated using the ATLAS9 and MARCS codes. New opacity distribution functions were generated to calculate ATLAS9 model photospheres. MARCS models were calculated based on opacity sampling techniques. The metallicity ([M/H]) spans from -5 to 1.5 for ATLAS and -2.5 to 0.5 for MARCS models. There are three main differences with respect to previous ATLAS9 model grids: a new corrected H2O linelist, a wide range of carbon ([C/M]) and alpha element [alpha/M] variations, and solar reference abundances from Asplund et al. 2005. The added range of varying carbon and alpha element abundances also extends the previously calculated MARCS model grids. Altogether 1980 chemical compositions were used for the ATLAS9 grid, and 175 for the MARCS grid. Over 808 thousand ATLAS9 models were computed spanning temperatures from 3500K to 30000K and log g from 0 to 5, where larger temperatures only have high gravities. The MARCS models span from 3500K to 5500K, and log g from 0 to 5. All model atmospheres are publically available online.
AI Key Findings
Get AI-generated insights about this paper's methodology, results, significance, and more — seven facets brought into focus.
Discussion 0