Publication
Metrics
AI Quick Summary
This research paper introduces new variability indices to detect variable stars in time series data, improving efficiency and reducing misclassification. It also proposes a universal analytical expression to select likely variables using the fraction-of-fluctuations on these indices.
Paper Preview
Abstract
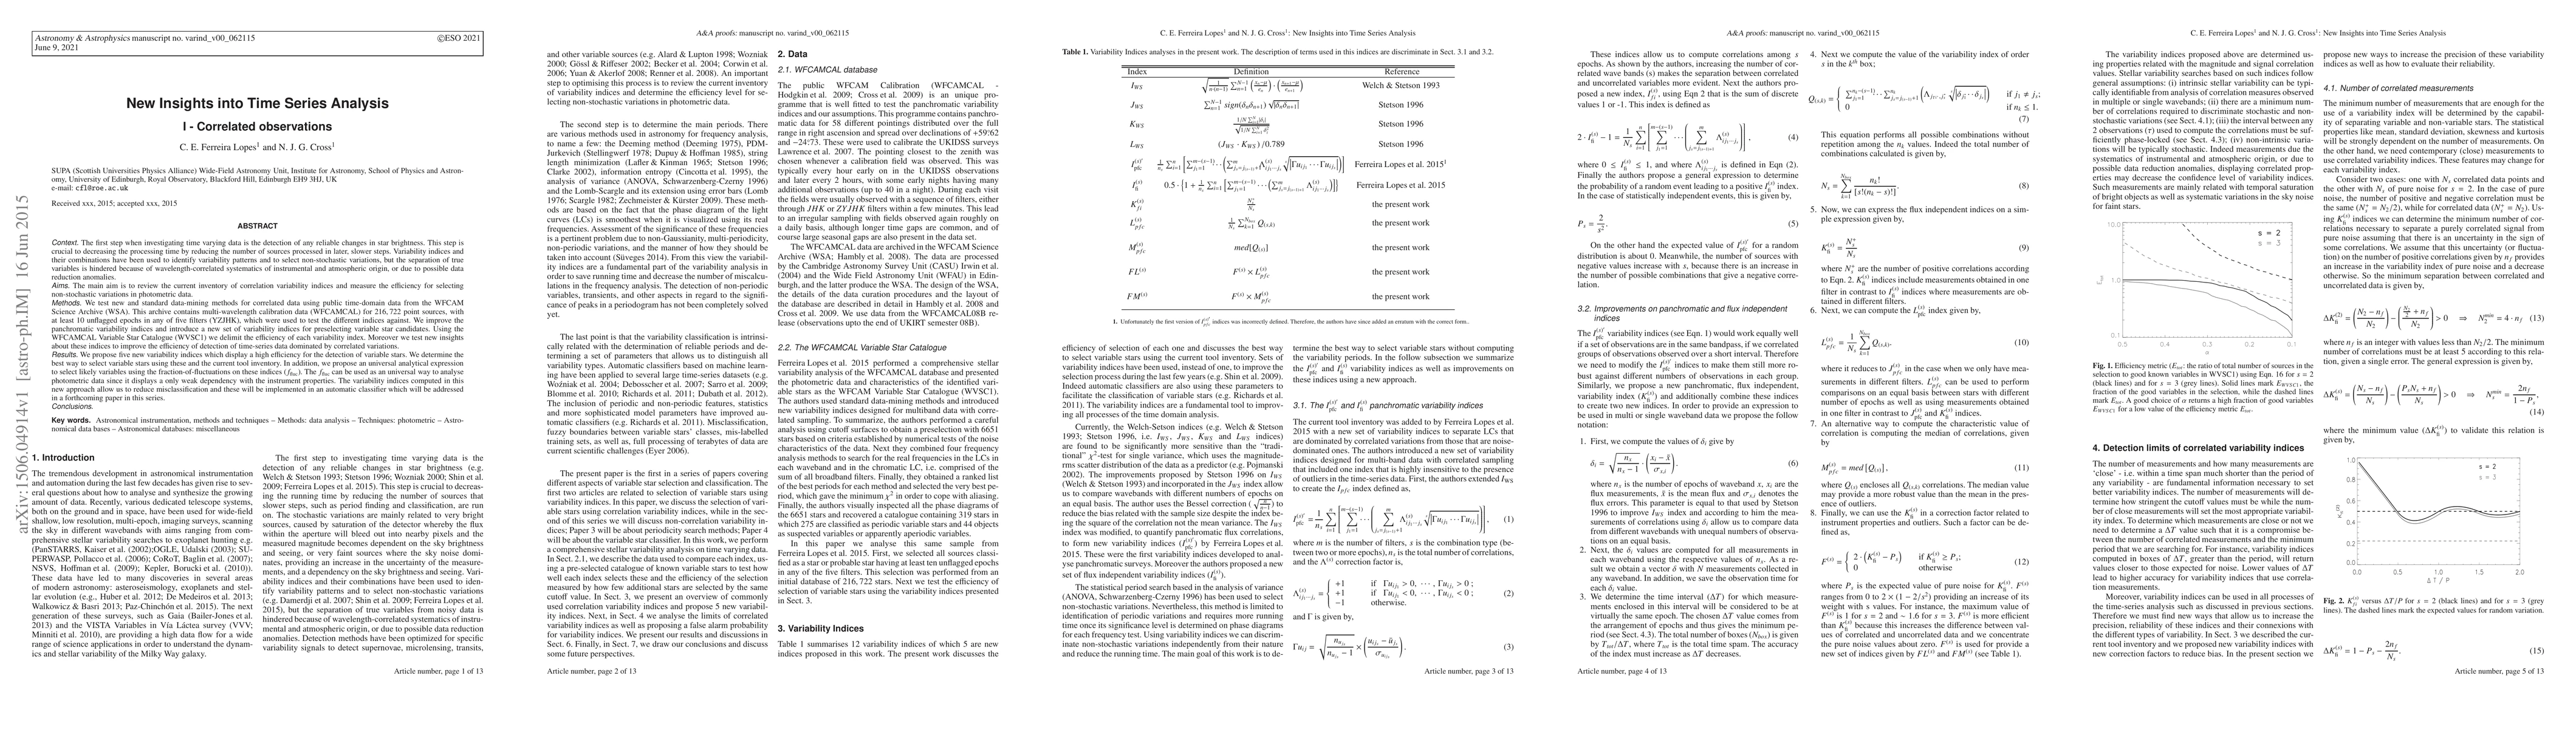
The first step when investigating time varying data is the detection of any reliable changes in star brightness. This step is crucial to decreasing the processing time by reducing the number of sources processed in later, slower steps. Variability indices and their combinations have been used to identify variability patterns and to select non-stochastic variations, but the separation of true variables is hindered because of wavelength-correlated systematics of instrumental and atmospheric origin, or due to possible data reduction anomalies. The main aim is to review the current inventory of correlation variability indices and measure the efficiency for selecting non-stochastic variations in photometric data. The WFCAM Science Archive (WSA) were used to test the different indices. We improve the panchromatic variability indices and introduce a new set of variability indices for preselecting variable star candidates. Using the WFCAMCAL Variable Star Catalogue (WVSC1) we delimit the efficiency of each variability index. Moreover we test new insights about these indices to improve the efficiency of detection of time-series data dominated by correlated variations. We propose five new variability indices which display a high efficiency for the detection of variable stars. We determine the best way to select variable stars using these and the current tool inventory. In addition, we propose an universal analytical expression to select likely variables using the fraction-of-fluctuations on these indices (f_fluc). The f_fluc can be used as an universal way to analyse photometric data since it displays a only weak dependency with the instrument properties. The variability indices computed in this new approach allow us to reduce misclassification and these will be implemented in an automatic classifier which will be addressed in a forthcoming paper in this series.
AI Key Findings
Get AI-generated insights about this paper's methodology, results, significance, and more — seven facets brought into focus.
Impact
Paper Details
PDF Preview
Key Terms
Citation Network
Current paper (gray), citations (green), references (blue)
Display is limited for performance on very large graphs.
Discussion 0