Publication
Metrics
AI Quick Summary
The H.E.S.S. experiment found no significant VHE gamma-ray signal from the nearby galaxy cluster Abell 85, constraining the cosmic ray energy content to less than 8% of the intra-cluster medium's thermal energy, aligning with lower model predictions.
Paper Preview
Abstract
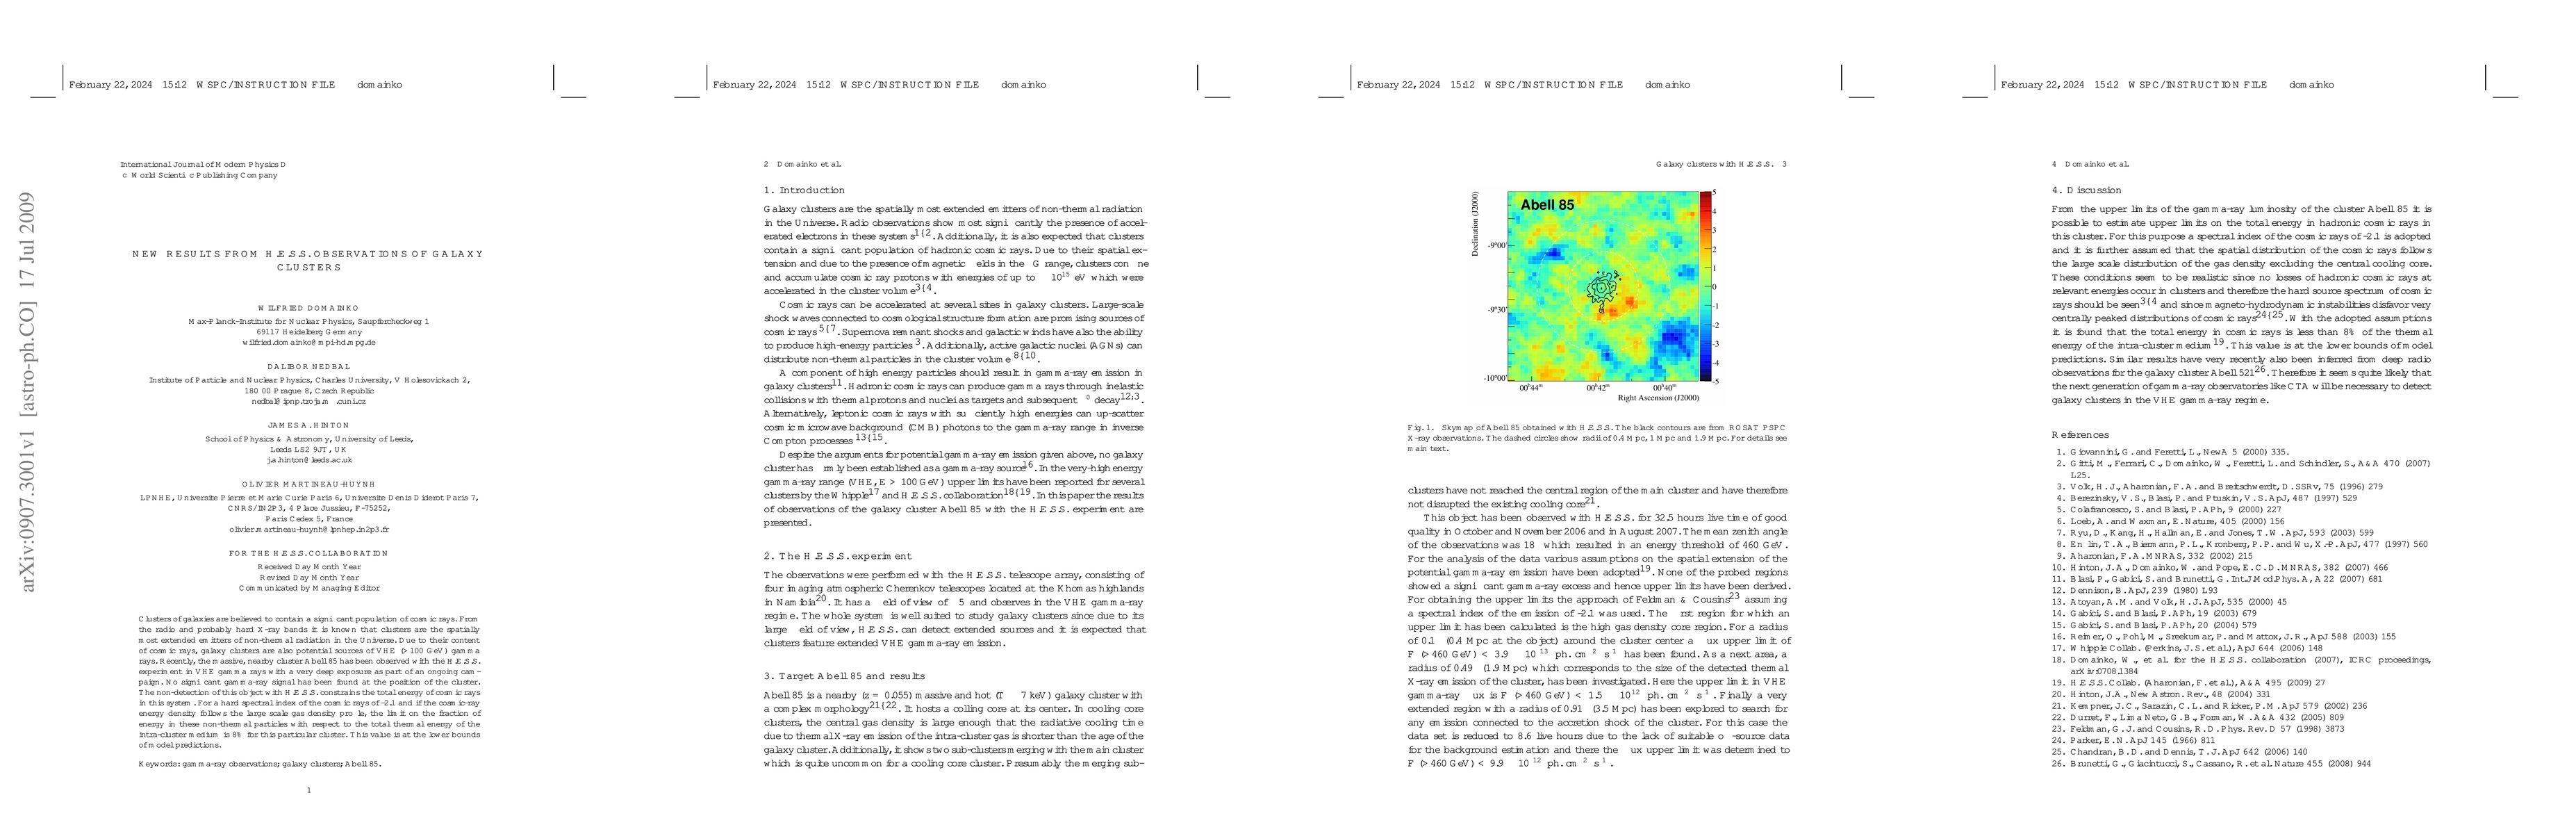
Clusters of galaxies are believed to contain a significant population of cosmic rays. From the radio and probably hard X-ray bands it is known that clusters are the spatially most extended emitters of non-thermal radiation in the Universe. Due to their content of cosmic rays, galaxy clusters are also potential sources of VHE (>100 GeV) gamma rays. Recently, the massive, nearby cluster Abell 85 has been observed with the H.E.S.S. experiment in VHE gamma rays with a very deep exposure as part of an ongoing campaign. No significant gamma-ray signal has been found at the position of the cluster. The non-detection of this object with H.E.S.S. constrains the total energy of cosmic rays in this system. For a hard spectral index of the cosmic rays of -2.1 and if the cosmic-ray energy density follows the large scale gas density profile, the limit on the fraction of energy in these non-thermal particles with respect to the total thermal energy of the intra-cluster medium is 8% for this particular cluster. This value is at the lower bounds of model predictions.
AI Key Findings
Get AI-generated insights about this paper's methodology, results, significance, and more — seven facets brought into focus.
Discussion 0