New Survey Questions and Estimators for Network Clustering with Respondent-Driven Sampling Data
Publication
Metrics
AI Quick Summary
This paper introduces new survey questions and estimators for estimating network clustering in respondent-driven sampling (RDS) data, which is typically used for public health studies. The authors develop tools to infer social network properties, demonstrating through simulations that clustering coefficient estimators remain effective despite RDS's non-random characteristics.
Paper Preview
Abstract
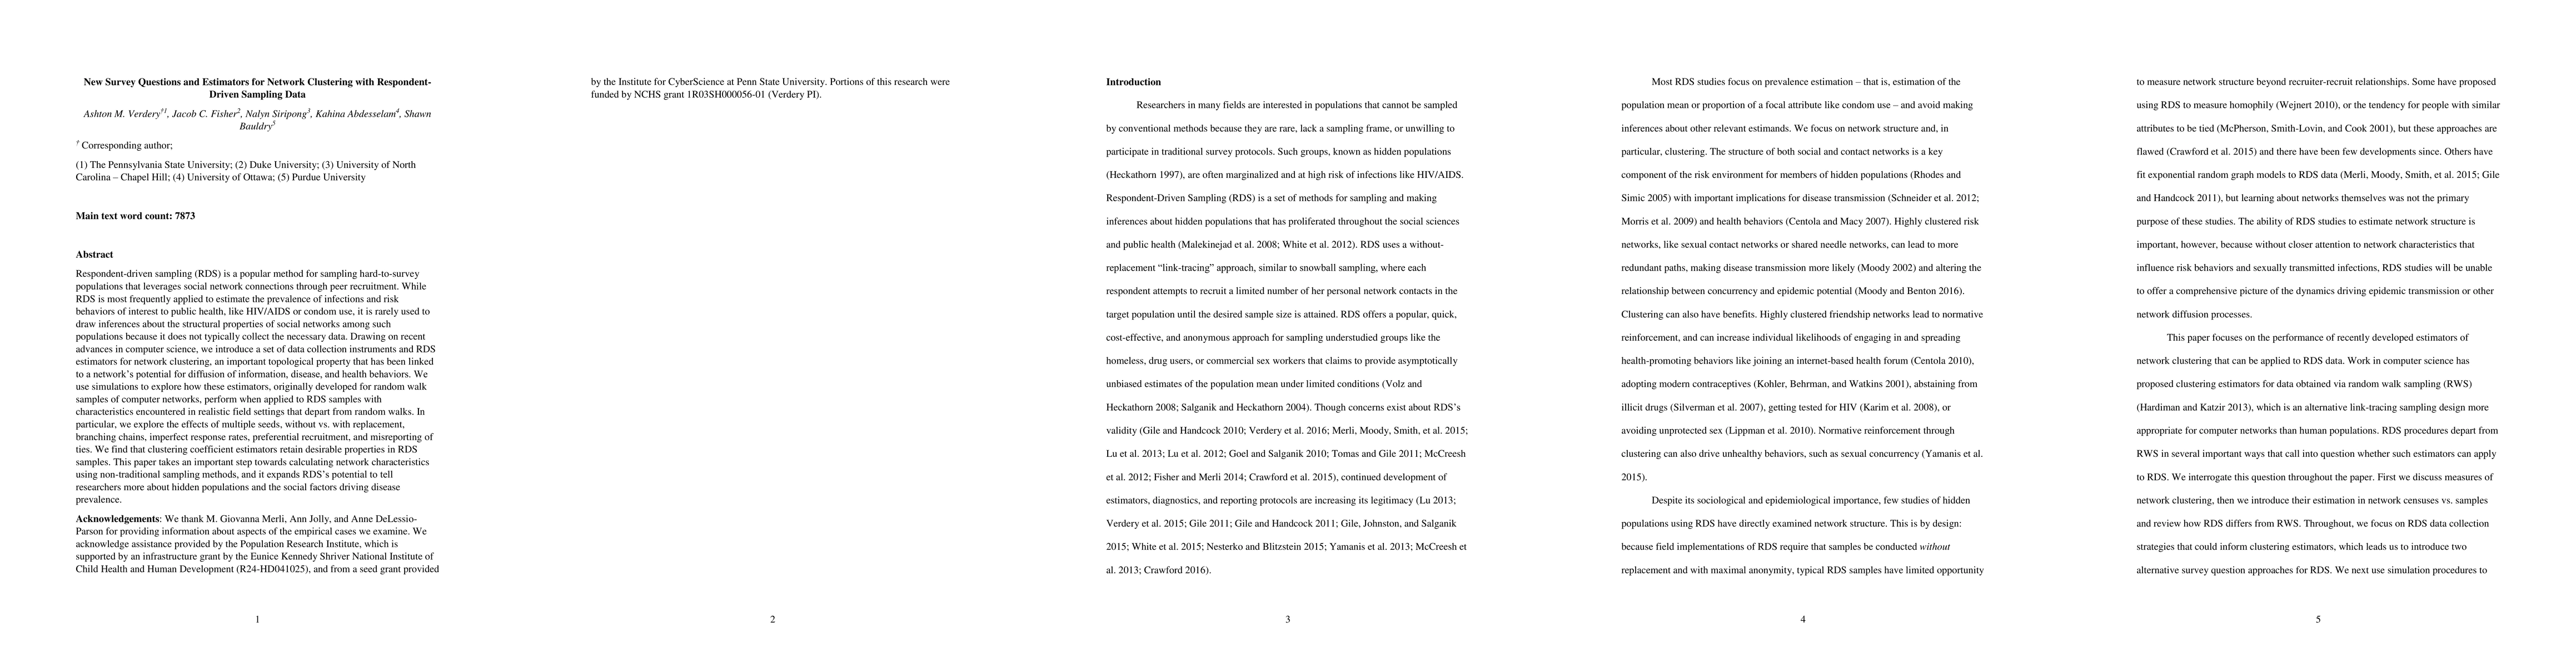
Respondent-driven sampling (RDS) is a popular method for sampling hard-to-survey populations that leverages social network connections through peer recruitment. While RDS is most frequently applied to estimate the prevalence of infections and risk behaviors of interest to public health, like HIV/AIDS or condom use, it is rarely used to draw inferences about the structural properties of social networks among such populations because it does not typically collect the necessary data. Drawing on recent advances in computer science, we introduce a set of data collection instruments and RDS estimators for network clustering, an important topological property that has been linked to a network's potential for diffusion of information, disease, and health behaviors. We use simulations to explore how these estimators, originally developed for random walk samples of computer networks, perform when applied to RDS samples with characteristics encountered in realistic field settings that depart from random walks. In particular, we explore the effects of multiple seeds, without vs. with replacement, branching chains, imperfect response rates, preferential recruitment, and misreporting of ties. We find that clustering coefficient estimators retain desirable properties in RDS samples. This paper takes an important step towards calculating network characteristics using non-traditional sampling methods, and it expands RDS's potential to tell researchers more about hidden populations and the social factors driving disease prevalence.
AI Key Findings
Get AI-generated insights about this paper's methodology, results, significance, and more — seven facets brought into focus.
Impact
Paper Details
PDF Preview
Key Terms
Citation Network
Current paper (gray), citations (green), references (blue)
Display is limited for performance on very large graphs.
Discussion 0