ArxivLens

Quick Summary:

The APACHE survey discovered over 80 new variable stars during its first observing season, despite its primary focus on detecting extrasolar planets around nearby M dwarfs. The survey analyzed data from numerous stellar fields, refined classifications and period estimates with the help of SuperWASP archival data, and highlighted unique characteristics of some variables.

arXiv Id: 1406.3260
Comments: accepted for publications in Journal of the American Association of Variable Star Observers (JAAVSO), Vol. 42. Typos in Table 1, column "Amplitude": from page 6 to 9 the first digit (equal to the page number) is actually an artifact and must be not considered
Date Published: 2014-06-16
Date Updated: 2014-06-16

Categories:

Key Terms (TF-IDF):

survey (0.245)
variables (0.242)
stars (0.228)
period (0.206)
classification (0.191)
periodicity (0.174)
aimed (0.162)
cool (0.162)
aperture (0.162)
dwarfs (0.157)
targeted (0.157)
planets (0.154)
thanks (0.154)
telescopes (0.153)
photometric (0.152)
observing (0.152)
separately (0.151)
database (0.146)
bright (0.144)
present new (0.144)
License: http://arxiv.org/licenses/nonexclusive-distrib/1.0/

Summary:

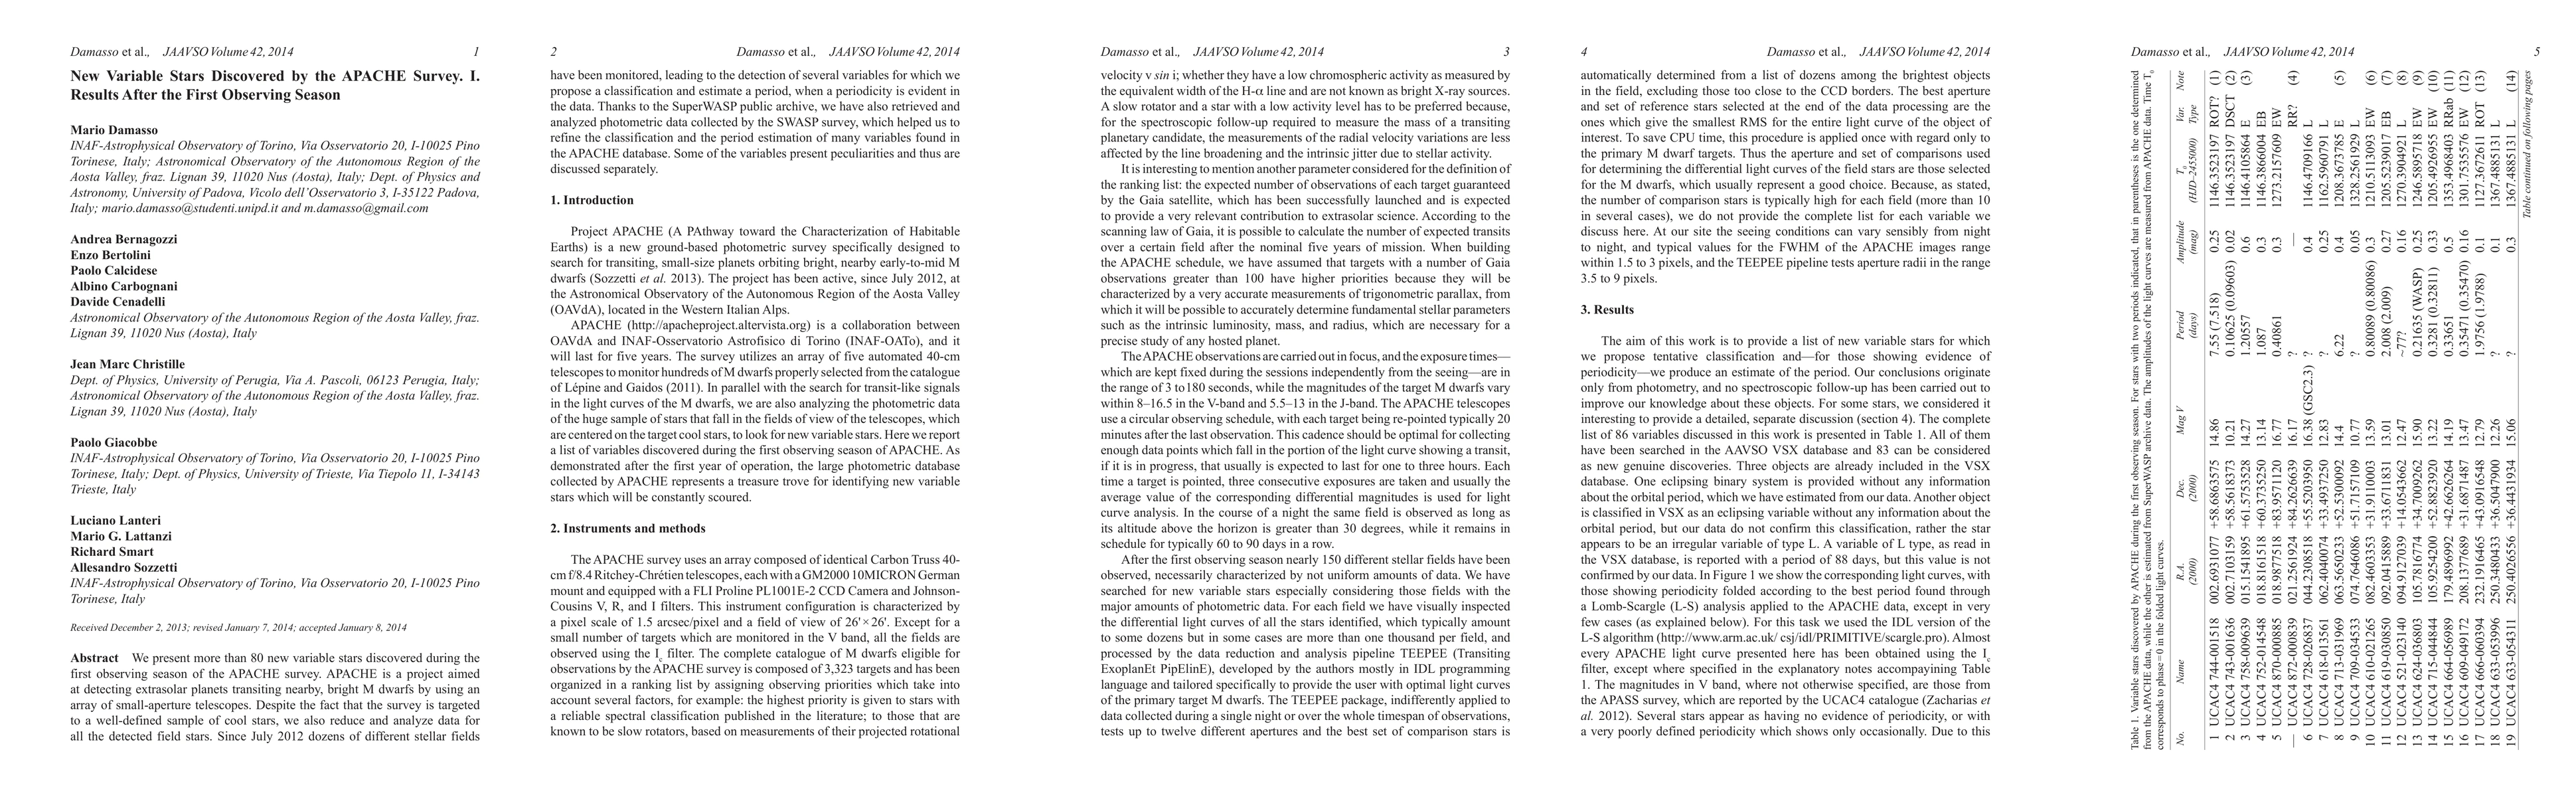
We present more than 80 new variable stars discovered during the first observing season of the APACHE survey. APACHE is a project aimed at detecting extrasolar planets transiting nearby, bright M dwarfs by using an array of small-aperture telescopes. Despite the fact that the survey is targeted to a well-defined sample of cool stars, we also reduce and analyze data for all the detected field stars. Since July 2012 dozens of different stellar fields have been monitored, leading to the detection of several variables for which we propose a classification and estimate a period, when a periodicity is evident in the data. Thanks to the SuperWASP public archive, we have also retrieved and analyzed photometric data collected by the SWASP survey, which helped us to refine the classification and the period estimation of many variables found in the APACHE database. Some of the variables present peculiarities and thus are discussed separately.

Citation & Reference Network Visualization

This graph shows how this paper is connected to other research. The current paper is shown in dark gray, papers that cite it are in green, and papers it references are in blue. You can:

Current Paper
Papers citing this work (Citations)
Papers cited by this work (References)

• Hover over any node to see the paper title

• Click a node to view that paper's details

• Drag nodes to rearrange the graph

• Use the zoom controls (bottom right) to zoom in/out

Citations and References

No citations found for this paper.

Comments (0)

This website uses cookies to ensure you get the best experience. Learn more