Publication
Metrics
AI Quick Summary
This paper models the nitrogen-to-oxygen (N/O) abundance pattern in star-forming galaxies, revealing a plateau at low metallicity followed by a rise with increasing metallicity. The study attributes the trend to contributions from both massive and low-mass stars, and highlights the necessity of differential galactic winds for accurate reproduction of observed high (N/O) ratios.
Paper Preview
Abstract
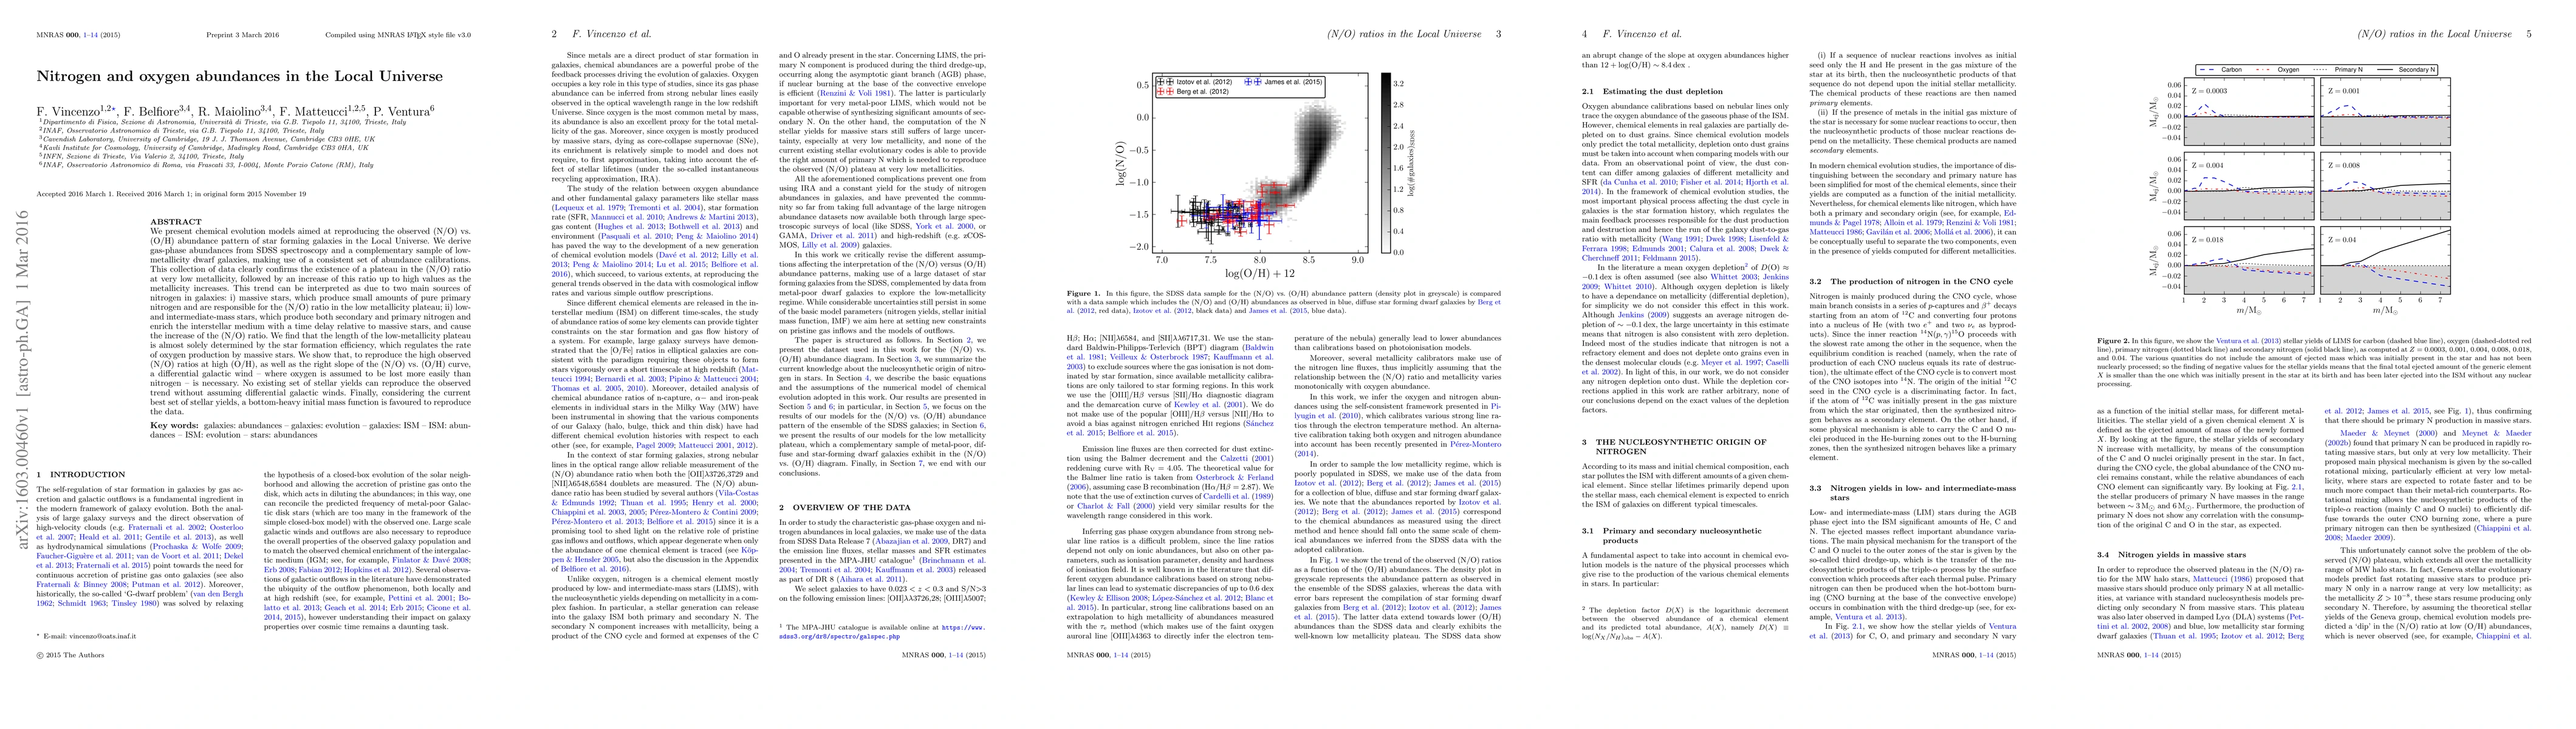
We present chemical evolution models aimed at reproducing the observed (N/O) vs. (O/H) abundance pattern of star forming galaxies in the Local Universe. We derive gas-phase abundances from SDSS spectroscopy and a complementary sample of low-metallicity dwarf galaxies, making use of a consistent set of abundance calibrations. This collection of data clearly confirms the existence of a plateau in the (N/O) ratio at very low metallicity, followed by an increase of this ratio up to high values as the metallicity increases. This trend can be interpreted as due to two main sources of nitrogen in galaxies: i) massive stars, which produce small amounts of pure primary nitrogen and are responsible for the (N/O) ratio in the low metallicity plateau; ii) low- and intermediate-mass stars, which produce both secondary and primary nitrogen and enrich the interstellar medium with a time delay relative to massive stars, and cause the increase of the (N/O) ratio. We find that the length of the low-metallicity plateau is almost solely determined by the star formation efficiency, which regulates the rate of oxygen production by massive stars. We show that, to reproduce the high observed (N/O) ratios at high (O/H), as well as the right slope of the (N/O) vs. (O/H) curve, a differential galactic wind - where oxygen is assumed to be lost more easily than nitrogen - is necessary. No existing set of stellar yields can reproduce the observed trend without assuming differential galactic winds. Finally, considering the current best set of stellar yields, a bottom-heavy initial mass function is favoured to reproduce the data.
AI Key Findings
Get AI-generated insights about this paper's methodology, results, significance, and more — seven facets brought into focus.
Impact
Paper Details
PDF Preview
Key Terms
Citation Network
Current paper (gray), citations (green), references (blue)
Display is limited for performance on very large graphs.
Discussion 0