A study evaluates three visualization techniques: node diagrams, node-link diagrams, and node-link-group diagrams, finding that adding links or group representations does not negatively impact performance on some tasks, but node-link-group diagrams outperform others on group-based tasks.
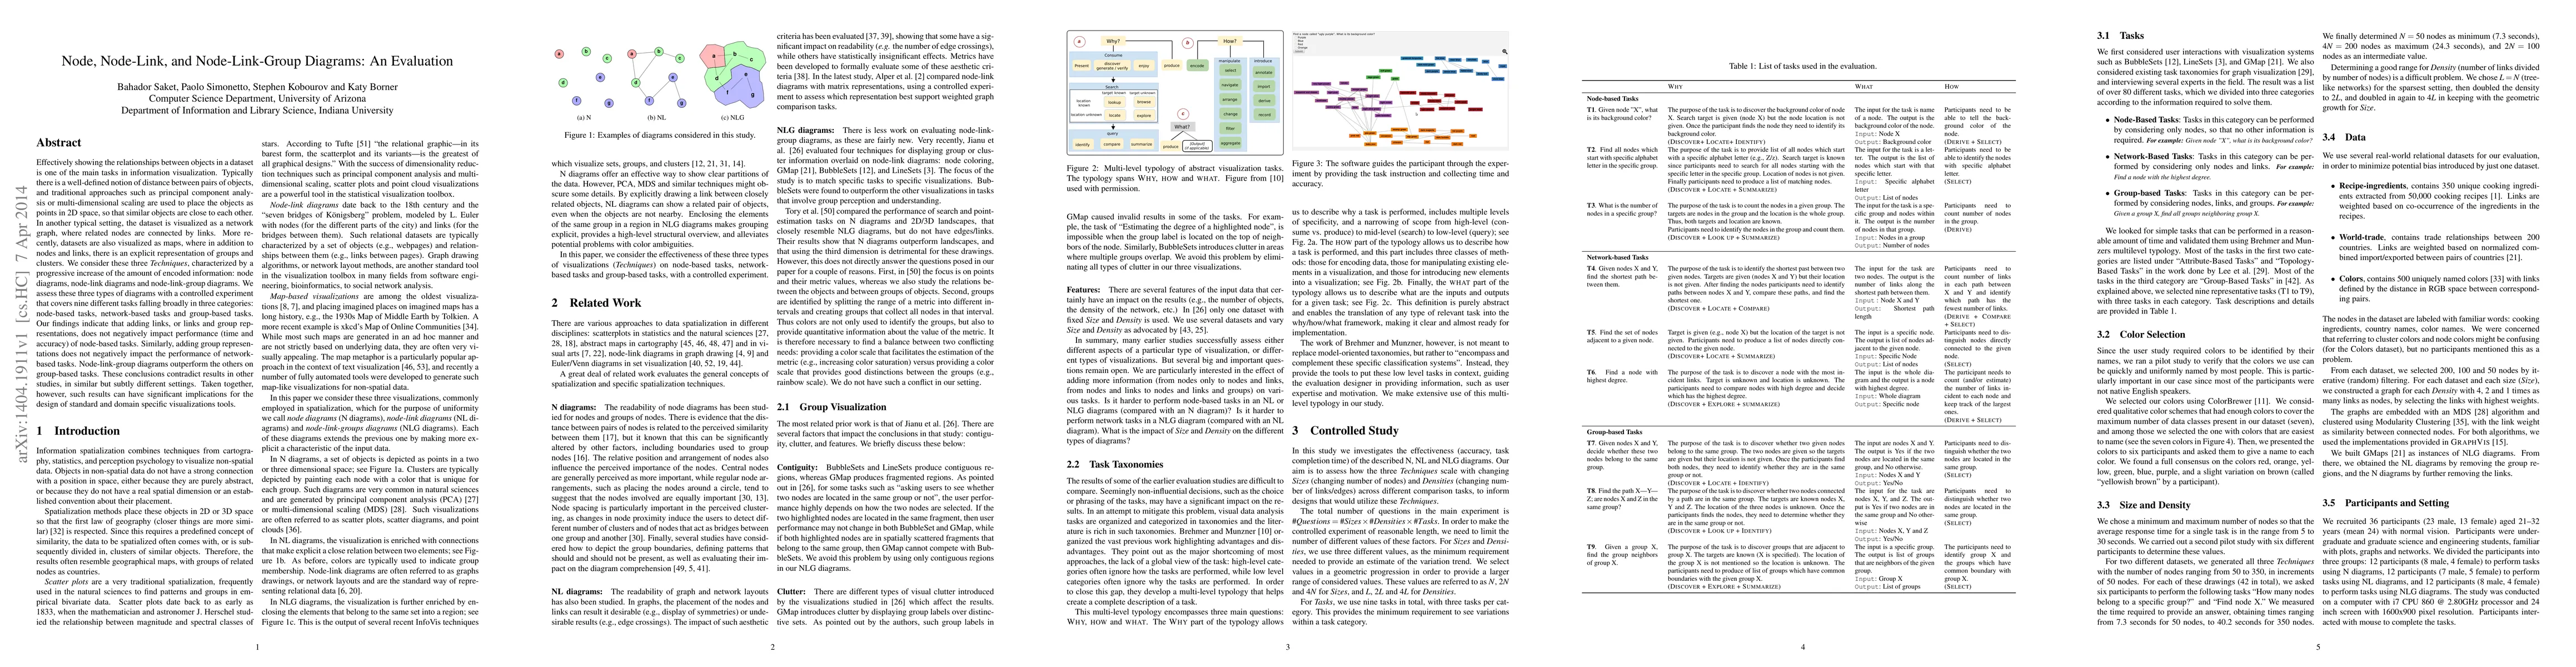
Effectively showing the relationships between objects in a dataset is one of the main tasks in information visualization. Typically there is a well-defined notion of distance between pairs of objects, and traditional approaches such as principal component analysis or multi-dimensional scaling are used to place the objects as points in 2D space, so that similar objects are close to each other. In another typical setting, the dataset is visualized as a network graph, where related nodes are connected by links. More recently, datasets are also visualized as maps, where in addition to nodes and links, there is an explicit representation of groups and clusters. We consider these three Techniques, characterized by a progressive increase of the amount of encoded information: node diagrams, node-link diagrams and node-link-group diagrams. We assess these three types of diagrams with a controlled experiment that covers nine different tasks falling broadly in three categories: node-based tasks, network-based tasks and group-based tasks. Our findings indicate that adding links, or links and group representations, does not negatively impact performance (time and accuracy) of node-based tasks. Similarly, adding group representations does not negatively impact the performance of network-based tasks. Node-link-group diagrams outperform the others on group-based tasks. These conclusions contradict results in other studies, in similar but subtly different settings. Taken together, however, such results can have significant implications for the design of standard and domain specific visualizations tools.
Get AI-generated insights about this paper's methodology, results, and significance.
Current paper (gray), citations (green), references (blue)
Mahadeo A. Sukhai, Yichun Zhao, Miguel A. Nacenta et al.
Title | Authors | Year | Actions |
---|---|---|---|
Immersed in my Ideas: Using Virtual Reality and Multimodal Interactions to Visualize Users' Ideas and Thoughts
|
Yunhao Xing, Jerrick Ban, Timothy D Hubbard, Michael Villano, Diego Gomez-Zara
|
2024
|
View Paper |
Towards Better Utilization of Haptic Interaction in Visualization: Design Space and Knob Prototype
|
Gefei Zhang, Guodao Sun, Zifeng Sun, Jingwei Tang, Li Jiang, Ronghua Liang
|
2024
|
View Paper |
GuidelineExplorer -- Navigating through the Forrest of Actionable Guidelines on Node-Link Graph Visualization
|
Kathrin Guckes, Lisa Eisenhardt, Margit Pohl, T. V. Landesberger
|
2024
|
View Paper |
Using Humanoid Robots to Obtain High-Quality Motor Imagery Electroencephalogram Data for Better Brain–Computer Interaction
|
Shiwei Cheng, Jialing Wang, Jieming Tian, Anjie Zhu, Jing Fan
|
2024
|
View Paper |
EulerMerge: Simplifying Euler Diagrams Through Set Merges
|
Xinyuan Yan, Peter Rodgers, P. Rottmann, D. Archambault, J. Haunert, Bei Wang
|
2023
|
View Paper |
A Mass‐Conserving‐Perceptron for Machine‐Learning‐Based Modeling of Geoscientific Systems
|
Yuan-Heng Wang, Hoshin V. Gupta
|
2023
|
View Paper |
Toward Addressing Ambiguous Interactions and Inferring User Intent with Dimension Reduction and Clustering Combinations in Visual Analytics
|
John E. Wenskovitch, Michelle Dowling, Chris North
|
2023
|
View Paper |
Comparative Study and Evaluation of Hybrid Visualizations of Graphs
|
E. D. Giacomo, W. Didimo, G. Liotta, F. Montecchiani, Alessandra Tappini
|
2023
|
View Paper |
Untangling Force-Directed Layouts Using Persistent Homology
|
Bhavana Doppalapudi, Bei Wang, P. Rosen
|
2022
|
View Paper |
Browser-based Hyperbolic Visualization of Graphs
|
Jacob Miller, S. Kobourov, Vahan Huroyan
|
2022
|
View Paper |
A Biomedical Open Knowledge Network Harnesses the Power of AI to Understand Deep Human Biology
|
S. Baranzini, K. Börner, J. Morris, Charlotte A. Nelson, Karthik Soman, Erica Schleimer, Michael J. Keiser, M. Musen, R. Pearce, Tahsin Reza, Brett Smith, Bruce Herr II, B. Oskotsky, Angela Rizk-Jackson, Katherine P Rankin, Stephan J. Sanders, R. Bove, Peter W Rose, Sharat Israni, Sui Huang
|
2022
|
View Paper |
Graph Neural Networks for Graph Drawing
|
Matteo Tiezzi, Gabriele Ciravegna, M. Gori
|
2021
|
View Paper |
A User Study on Hybrid Graph Visualizations
|
E. D. Giacomo, W. Didimo, F. Montecchiani, Alessandra Tappini
|
2021
|
View Paper |
It’s a Wrap: Toroidal Wrapping of Network Visualisations Supports Cluster Understanding Tasks
|
Kun-Ting Chen, Tim Dwyer, Benjamin Bach, K. Marriott
|
2021
|
View Paper |
TrammelGraph: visual graph abstraction for comparison
|
Zhuochen Jin, Nan Chen, Yang Shi, Weihong Qian, Maoran Xu, Nan Cao
|
2021
|
View Paper |
Drawing Graphs on the Sphere
|
Scott Perry, Mason Sun Yin, Kathryn Gray, S. Kobourov
|
2020
|
View Paper |
Evaluating Visualizations of Sets and Networks that Use Euler Diagrams and Graphs
|
Almas Baimagambetov, Gem Stapleton, A. Blake, J. Howse
|
2020
|
View Paper |
MetroSets: Visualizing Sets as Metro Maps
|
Benjamin N. Jacobsen, Mark Wallinger, S. Kobourov, M. Nöllenburg
|
2020
|
View Paper |
An Examination of Grouping and Spatial Organization Tasks for High-Dimensional Data Exploration
|
John E. Wenskovitch, Chris North
|
2020
|
View Paper |
Augmenting Node‐Link Diagrams with Topographic Attribute Maps
|
R. Preiner, Johanna Schmidt, Katharina Krösl, Tobias Schreck, G. Mistelbauer
|
2020
|
View Paper |
Node-Link or Adjacency Matrices: Old Question, New Insights
|
Mershack Okoe, R. Jianu, S. Kobourov
|
2019
|
View Paper |
A Multi-Scale Map Method Based on Bioinspired Neural Network Algorithm for Robot Path Planning
|
Min Luo, Xiaorong Hou, Simon X. Yang
|
2019
|
View Paper |
Juxtaposing Controlled Empirical Studies in Visualization with Topic Developments in Psychology
|
Alfie Abdul-Rahman, R. Borgo, Min Chen, D. Edwards, Brian D. Fisher
|
2019
|
View Paper |
Dimension Reduction and Clustering for Interactive Visual Analytics
|
John E. Wenskovitch
|
2019
|
View Paper |
Multi-level tree based approach for interactive graph visualization with semantic zoom
|
F. D. Luca, Md. Iqbal Hossain, S. Kobourov, K. Börner
|
2019
|
View Paper |
Visual Annotations for Hybrid Graph-based User Model
|
V. Guchev, F. Cena, Fabiana Vernero, Cristina Gena
|
2019
|
View Paper |
Skill discrepancies between research, education, and jobs reveal the critical need to supply soft skills for the data economy
|
K. Börner, O. Scrivner, Mike Gallant, Shu-na Ma, Xiaozhong Liu, Keith Chewning, Lingfei Wu, James A. Evans
|
2018
|
View Paper |
Applying argumentation to structure and visualize multi-dimensional opinion spaces
|
Gregor Betz, M. Hamann, T. Mchedlidze, Sophie von Schmettow
|
2018
|
View Paper |
REMatch: Research Expert Matching System
|
Md. Iqbal Hossain, S. Kobourov, H. Purchase, M. Surdeanu
|
2018
|
View Paper |
Exploring the Limits of Complexity: A Survey of Empirical Studies on Graph Visualisation
|
Vahan Yoghourdjian, D. Archambault, S. Diehl, Tim Dwyer, Karsten Klein, H. Purchase, Hsiang-Yun Wu
|
2018
|
View Paper |
GRAM: global research activity map
|
Randy Burd, K. Espy, Md. Iqbal Hossain, S. Kobourov, Nirav C. Merchant, H. Purchase
|
2018
|
View Paper |
Science map metaphors: a comparison of network versus hexmap-based visualizations
|
K. Börner, Adam H. Simpson, Andreas Bueckle, Robert L. Goldstone
|
2018
|
View Paper |
Overlaying Quantitative Measurement on Networks: An Evaluation of Three Positioning and Nine Visual Marker Techniques
|
Guohao Zhang, A. Auchus, P. Kochunov, N. Elmqvist, Jian Chen
|
2017
|
View Paper |
Design and evaluation of line symbolizations for origin–destination flow maps
|
Caglar Koylu, Diansheng Guo
|
2017
|
View Paper |
Data and Task Based Effectiveness of Basic Visualizations
|
B. Saket, A. Endert, Çağatay Demiralp
|
2017
|
View Paper |
Visualizing Group Structures in Graphs: A Survey
|
Corinna Vehlow, Fabian Beck, D. Weiskopf
|
2017
|
View Paper |
Revisited Experimental Comparison of Node-Link and Matrix Representations
|
Mershack Okoe, R. Jianu, S. Kobourov
|
2017
|
View Paper |
VisAR: Bringing Interactivity to Static Data Visualizations through Augmented Reality
|
Taeheon Kim, B. Saket, A. Endert, B. MacIntyre
|
2017
|
View Paper |
Research Topics Map: rtopmap
|
Md. Iqbal Hossain, S. Kobourov
|
2017
|
View Paper |
Empirically Measuring Soft Knowledge in Visualization
|
Natchaya Kijmongkolchai, Alfie Abdul-Rahman, Min Chen
|
2017
|
View Paper |
Blockmap: an interactive visualization tool for big-data networks
|
Terrill L. Frantz
|
2017
|
View Paper |
Investigating aspects of data visualization literacy using 20 information visualizations and 273 science museum visitors
|
K. Börner, A. Maltese, R. N. Balliet, J. Heimlich
|
2016
|
View Paper |
Comparing Node‐Link and Node‐Link‐Group Visualizations From An Enjoyment Perspective
|
B. Saket, C. Scheidegger, S. Kobourov
|
2016
|
View Paper |
Map‐based Visualizations Increase Recall Accuracy of Data
|
B. Saket, C. Scheidegger, S. Kobourov, K. Börner
|
2015
|
View Paper |
Towards Understanding Enjoyment and Flow in Information Visualization
|
B. Saket, C. Scheidegger, S. Kobourov
|
2015
|
View Paper |
IMap: visualizing network activity over internet maps
|
J. Fowler, Michael Schneider, Thienne M. Johnson, C. Acedo, Loukas Lazos, Paolo Simonetto, S. Kobourov, paolosimonetto thienne, cajac mschneid
|
2014
|
View Paper |
Are Crossings Important for Drawing Large Graphs?
|
S. Kobourov, S. Pupyrev, B. Saket
|
2014
|
View Paper |
Group-Level Graph Visualization Taxonomy
|
B. Saket, Paolo Simonetto, S. Kobourov
|
2014
|
View Paper |
A Constructivism-based Approach to Treemap Literacy in the Classroom
|
Elif E. Firat, Colm Lang, Bhumika Srinivas, Ilena Peng, R. Laramee, Alark Joshi
|
2023
|
View Paper |
Visualizing Mappings Between Pairwise Ontologies - An Empirical Study of Matrix and Linked Indented List in Their User Support During Class Mapping Creation and Evaluation
|
Bo Fu, Allison Austin, Max Garcia
|
2023
|
View Paper |
NetVisGame: Mobile Gamified Information Visualization of Home Network Traffic Data
|
Marija Schufrin, Katharina Kuban, Arjan Kuijper, J. Kohlhammer
|
2022
|
View Paper |
The State of the Art in Empirical User Evaluation of Graph Visualizations
|
Michael Burch, Weidong Huang, Mathew Wakefield, H. Purchase, D. Weiskopf, Jie Hua
|
2021
|
View Paper |
Toward an Interactive Voronoi Treemap for Manual Arrangement and Grouping
|
Ala Abuthawabeh, Michaël Aupetit
|
2021
|
View Paper |
A Multi-Layout Approach to Immersive Visualization of Network Data
|
David Bauer, Chengbo Zheng, Oh-Hyun Kwon, K. Ma
|
2021
|
View Paper |
Diagrammatic Representation and Inference: 11th International Conference, Diagrams 2020, Tallinn, Estonia, August 24–28, 2020, Proceedings
|
P. Chapman, L. B. Smet, Valeria Giardino, J. Corter, Sven Linker
|
2020
|
View Paper |
Machine Learning from Interactions in Multi-Model Visual Analytics
|
John E. Wenskovitch
|
2019
|
View Paper |
Active Reading of Visualizations
|
Jagoda Walny, Samuel Huron, Charles Perin, Tiffany Wun, R. Pusch, Sheelagh Carpendale
|
2018
|
View Paper |
The Cognitive and Computational Benefits and Limitations of Clustering for Sensemaking
|
John E. Wenskovitch, Michelle Dowling, Chris North
|
2018
|
View Paper |
Revisited Network Representations
|
Mershack Okoe, R. Jianu, S. Kobourov
|
2017
|
View Paper |
Supplemental Material : Active Reading of Visualizations
|
2016
|
View Paper | |
Supporting web-based and crowdsourced evaluations of data visualizations
|
Mershack Okoe
|
2016
|
View Paper |
The State of the Art in Visualizing Group Structures in Graphs
|
Corinna Vehlow, Fabian Beck, D. Weiskopf
|
2015
|
View Paper |
Journal of Graph Algorithms and Applications Mapsets: Visualizing Embedded and Clustered Graphs
|
A. Efrat, Yifan Hu, S. Kobourov, S. Pupyrev, C. Duncan, A. Symvonis
|
View Paper |
Comments (0)