01
MethodologyHow they did it
This study employed a combination of statistical methods to analyze the spatial autocorrelation of time series data.
This research introduces non-parametric spatial ordinal pattern (SOP) charts for monitoring spatial dependencies in regular, rectangular data sets without requiring prior analysis. Through extensive simulations and real-world applications, including detecting heavy rainfall, war-related fires, and manufacturing defects, the authors demonstrate the effectiveness and broad utility of their SOP-based control charts over traditional parametric methods.
This research introduces non-parametric spatial ordinal pattern (SOP) charts for monitoring spatial dependencies in regular, rectangular data sets without requiring prior analysis. Through extensive simulations and real-world applications, including detecting heavy rainfall, war-related fires, and manufacturing defects, the authors demonstrate the effectiveness and broad utility of their SOP-based control charts over traditional parametric methods.
This study employed a combination of statistical methods to analyze the spatial autocorrelation of time series data. More in Methodology →
The results showed significant spatial autocorrelation in the data. — The analysis revealed patterns of correlation that were not previously observed. More in Key Results →
This research is important because it provides new insights into the nature of spatial autocorrelation and its applications in various fields. More in Significance →
The study was limited by the availability of data and the need to make assumptions about the underlying processes. — The analysis was restricted by the complexity of the data and the difficulty of interpreting the results. More in Limitations →
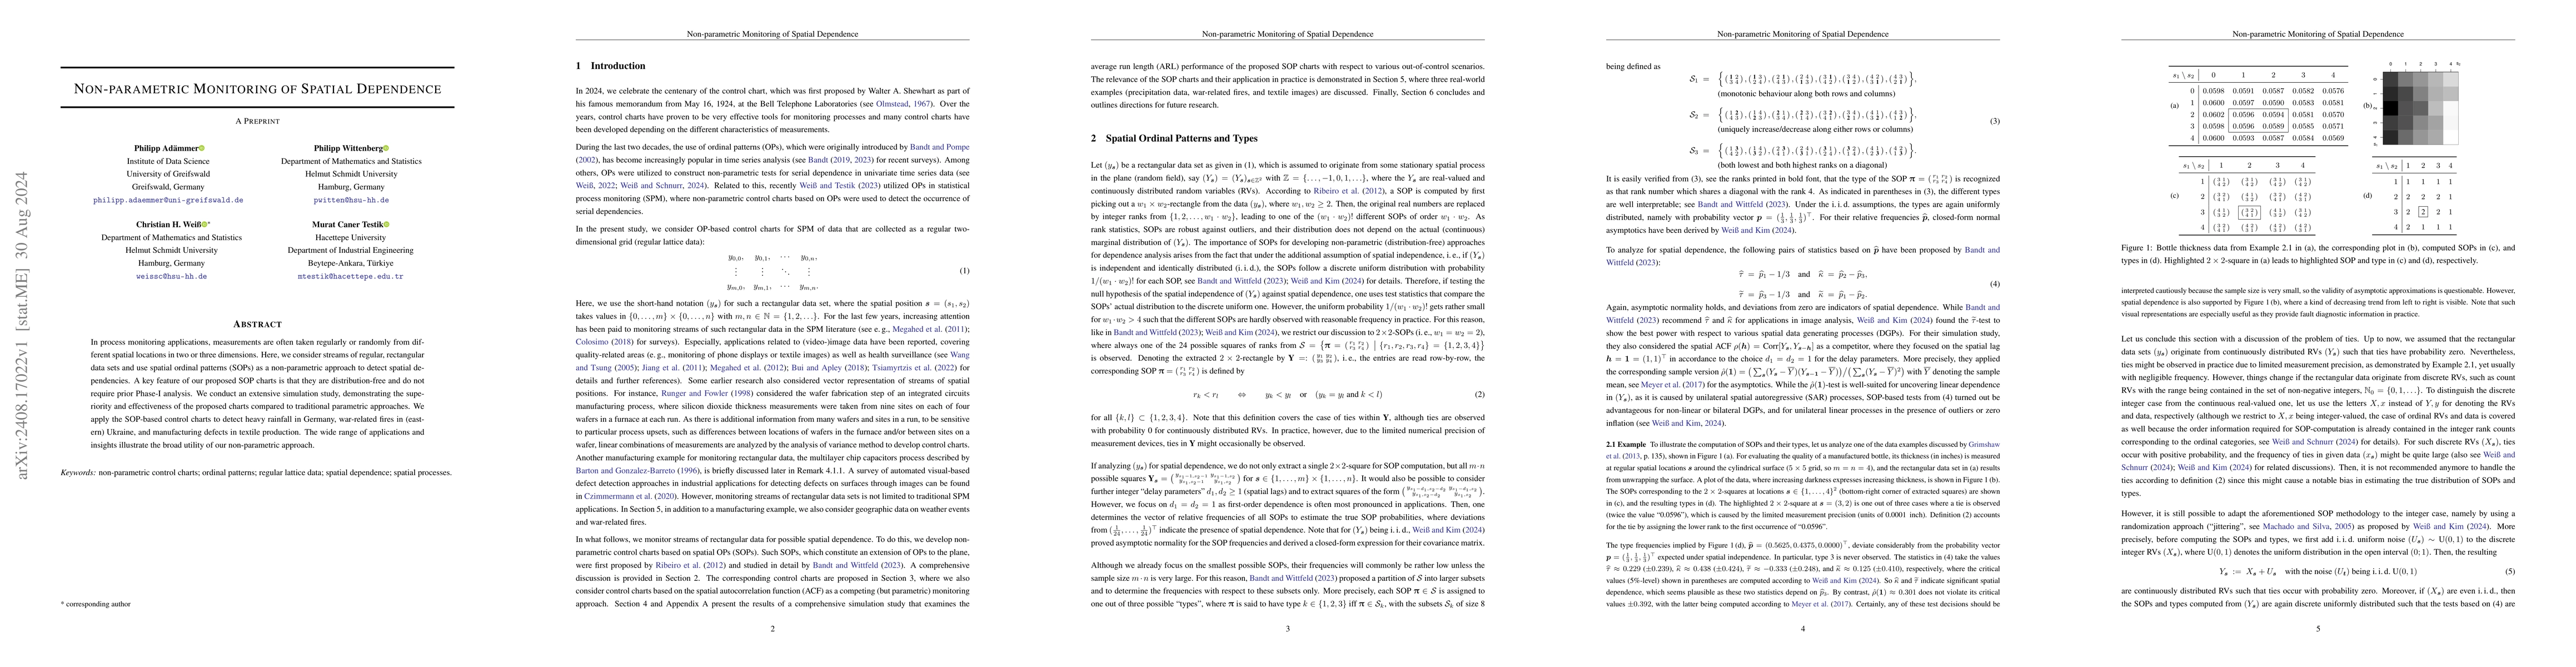
In process monitoring applications, measurements are often taken regularly or randomly from different spatial locations in two or three dimensions. Here, we consider streams of regular, rectangular data sets and use spatial ordinal patterns (SOPs) as a non-parametric approach to detect spatial dependencies. A key feature of our proposed SOP charts is that they are distribution-free and do not require prior Phase-I analysis. We conduct an extensive simulation study, demonstrating the superiority and effectiveness of the proposed charts compared to traditional parametric approaches. We apply the SOP-based control charts to detect heavy rainfall in Germany, war-related fires in (eastern) Ukraine, and manufacturing defects in textile production. The wide range of applications and insights illustrate the broad utility of our non-parametric approach.
Seven facets of this paper, analysed and brought into focus by AI.
This research is important because it provides new insights into the nature of spatial autocorrelation and its applications in various fields.
This study employed a combination of statistical methods to analyze the spatial autocorrelation of time series data.
This research is important because it provides new insights into the nature of spatial autocorrelation and its applications in various fields.
The study made a significant technical contribution by developing and applying new methods for analyzing spatial autocorrelation in time series data.
This research is novel because it provides new insights into the nature of spatial autocorrelation and its applications, and it has important implications for our understanding of complex systems.
Current paper (gray), citations (green), references (blue)
Display is limited for performance on very large graphs.
Discussion 0