Nonlinear Multi-Carrier System with Signal Clipping: Measurement, Analysis, and Optimization
Publication
Metrics
AI Quick Summary
This paper analyzes the nonlinear distortion in OFDM systems due to power amplifier (PA) nonlinearity and signal clipping, using the BFPA model and IMP analysis. It derives expressions for SNR and SER to optimize the system performance considering both PA nonlinearity and clipping distortion.
Paper Preview
Abstract
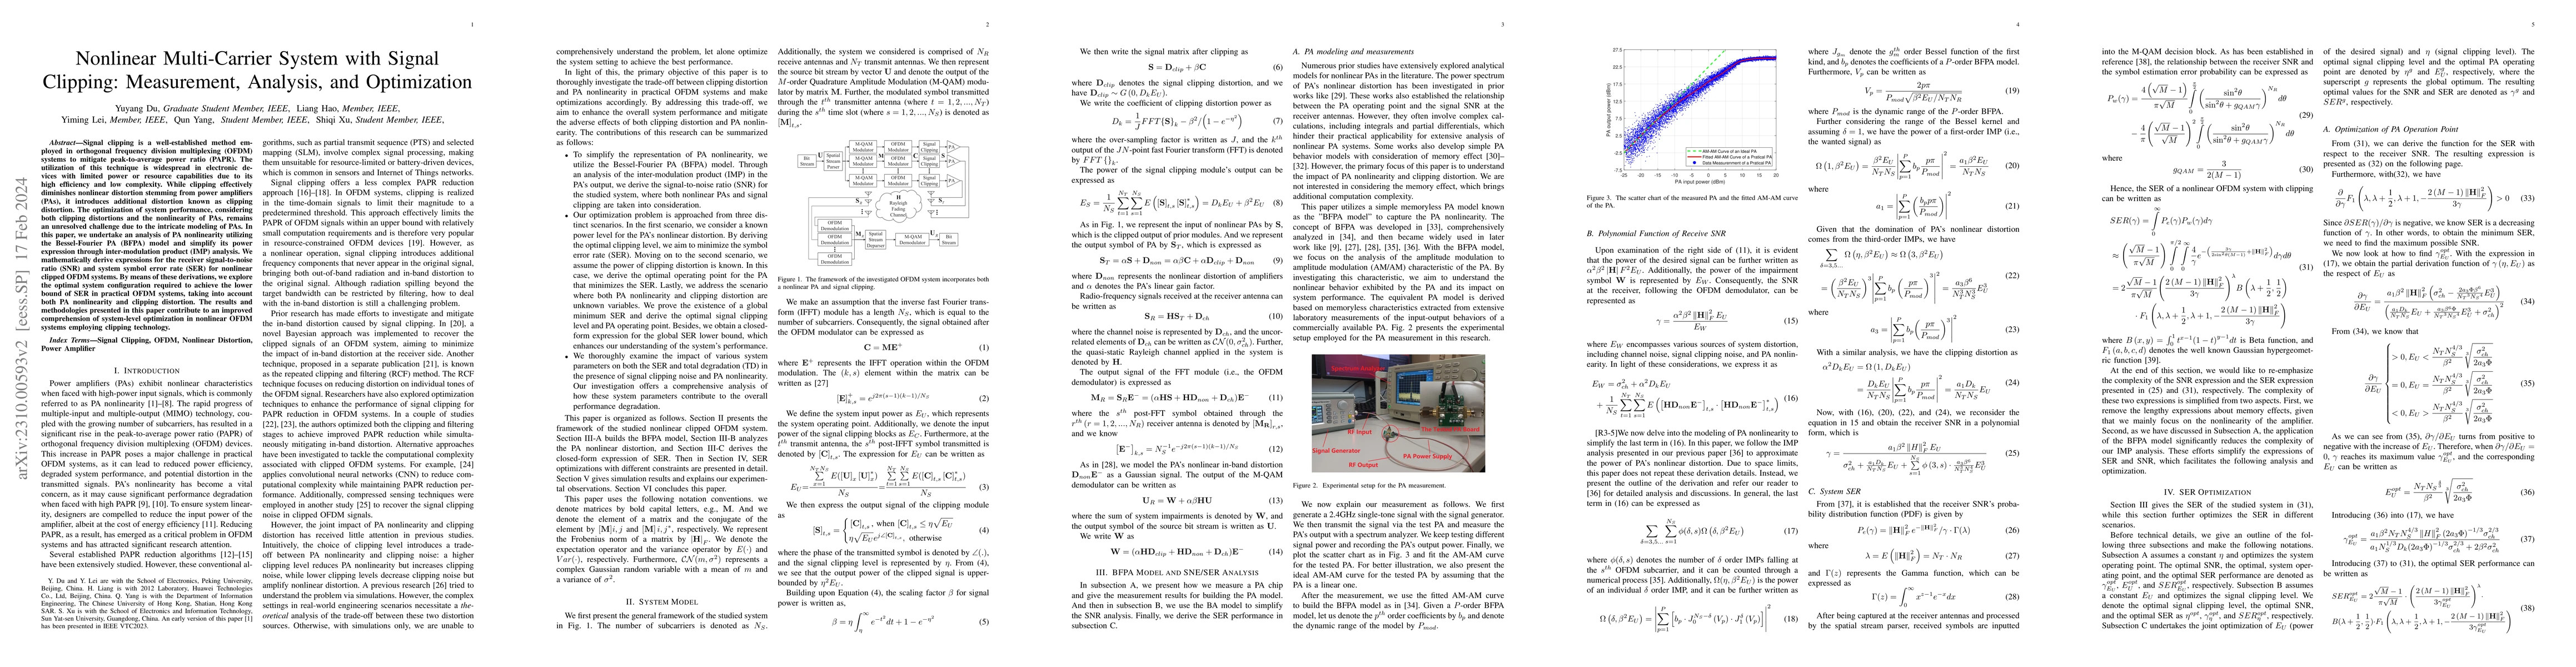
Signal clipping is a classic technique for reducing peak-to-average power ratio (PAPR) in orthogonal frequency division multiplexing (OFDM) systems. It has been widely applied in consumer electronic devices owing to its low complexity and high efficiency. Although clipping reduces the nonlinear distortion caused by power amplifiers (PAs), it induces additional clipping distortion. Optimizing the joint system performance with consideration of both PA nonlinearity and clipping distortion remains an open problem due to the complex PA modeling. In this paper, we analyze the PA nonlinearity through the Bessel-Fourier PA (BFPA) model and simplify its power expression using inter-modulation product (IMP) analysis. We derive expressions of the receiver signal-to-noise ratio (SNR) and system symbol error rate (SER) for the nonlinear clipped OFDM system. With the derivations, we investigate the optimal system setting to achieve the SER lower bound in a practical OFDM system that considers both PA nonlinearity and clipping distortion. The methods and results presented in this paper can serve as a useful reference for the system-level optimization of clipped OFDM systems with nonlinear PA.
AI Key Findings
Get AI-generated insights about this paper's methodology, results, significance, and more — seven facets brought into focus.
Impact
Paper Details
Authors
PDF Preview
Key Terms
Citation Network
Current paper (gray), citations (green), references (blue)
Display is limited for performance on very large graphs.
Discussion 0