Authors
Summary
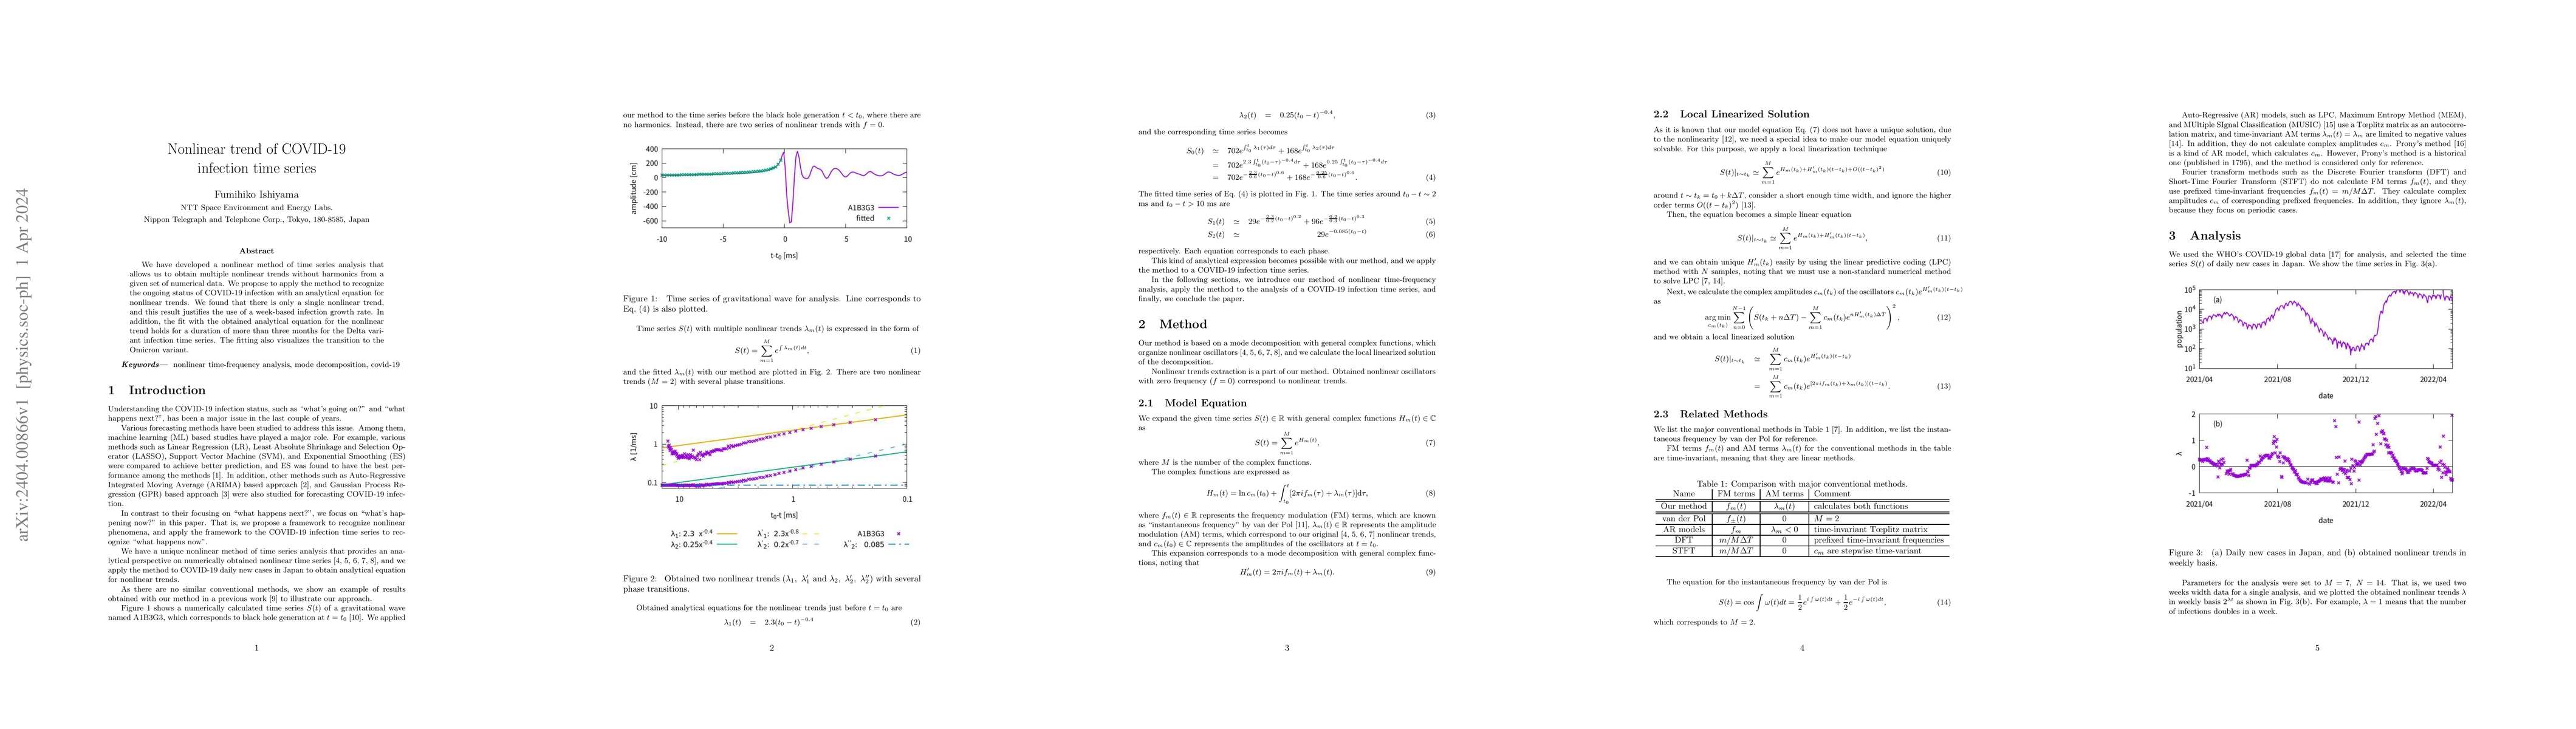
We have developed a nonlinear method of time series analysis that allows us to obtain multiple nonlinear trends without harmonics from a given set of numerical data. We propose to apply the method to recognize the ongoing status of COVID-19 infection with an analytical equation for nonlinear trends. We found that there is only a single nonlinear trend, and this result justifies the use of a week-based infection growth rate. In addition, the fit with the obtained analytical equation for the nonlinear trend holds for a duration of more than three months for the Delta variant infection time series. The fitting also visualizes the transition to the Omicron variant.
AI Key Findings
Get AI-generated insights about this paper's methodology, results, and significance.
Paper Details
PDF Preview
Key Terms
Citation Network
Current paper (gray), citations (green), references (blue)
Display is limited for performance on very large graphs.
Similar Papers
Found 4 papersInterpreting County Level COVID-19 Infection and Feature Sensitivity using Deep Learning Time Series Models
Di Zhu, Md Khairul Islam, Andrej Erkelens et al.
CIRO: COVID-19 infection risk ontology
Shusaku Egami, Yasunori Yamamoto, Ikki Ohmukai et al.
| Title | Authors | Year | Actions |
|---|
Comments (0)