Nonparametric estimation of highest density regions for COVID-19
Publication
Metrics
AI Quick Summary
This paper compares classical plug-in methods and a hybrid algorithm for estimating highest density regions, crucial for identifying COVID-19 hotspots, through simulations and real U.S. COVID-19 data analysis. The study aims to understand the spatial-temporal evolution of the pandemic by determining clusters in the data.
Paper Preview
Abstract
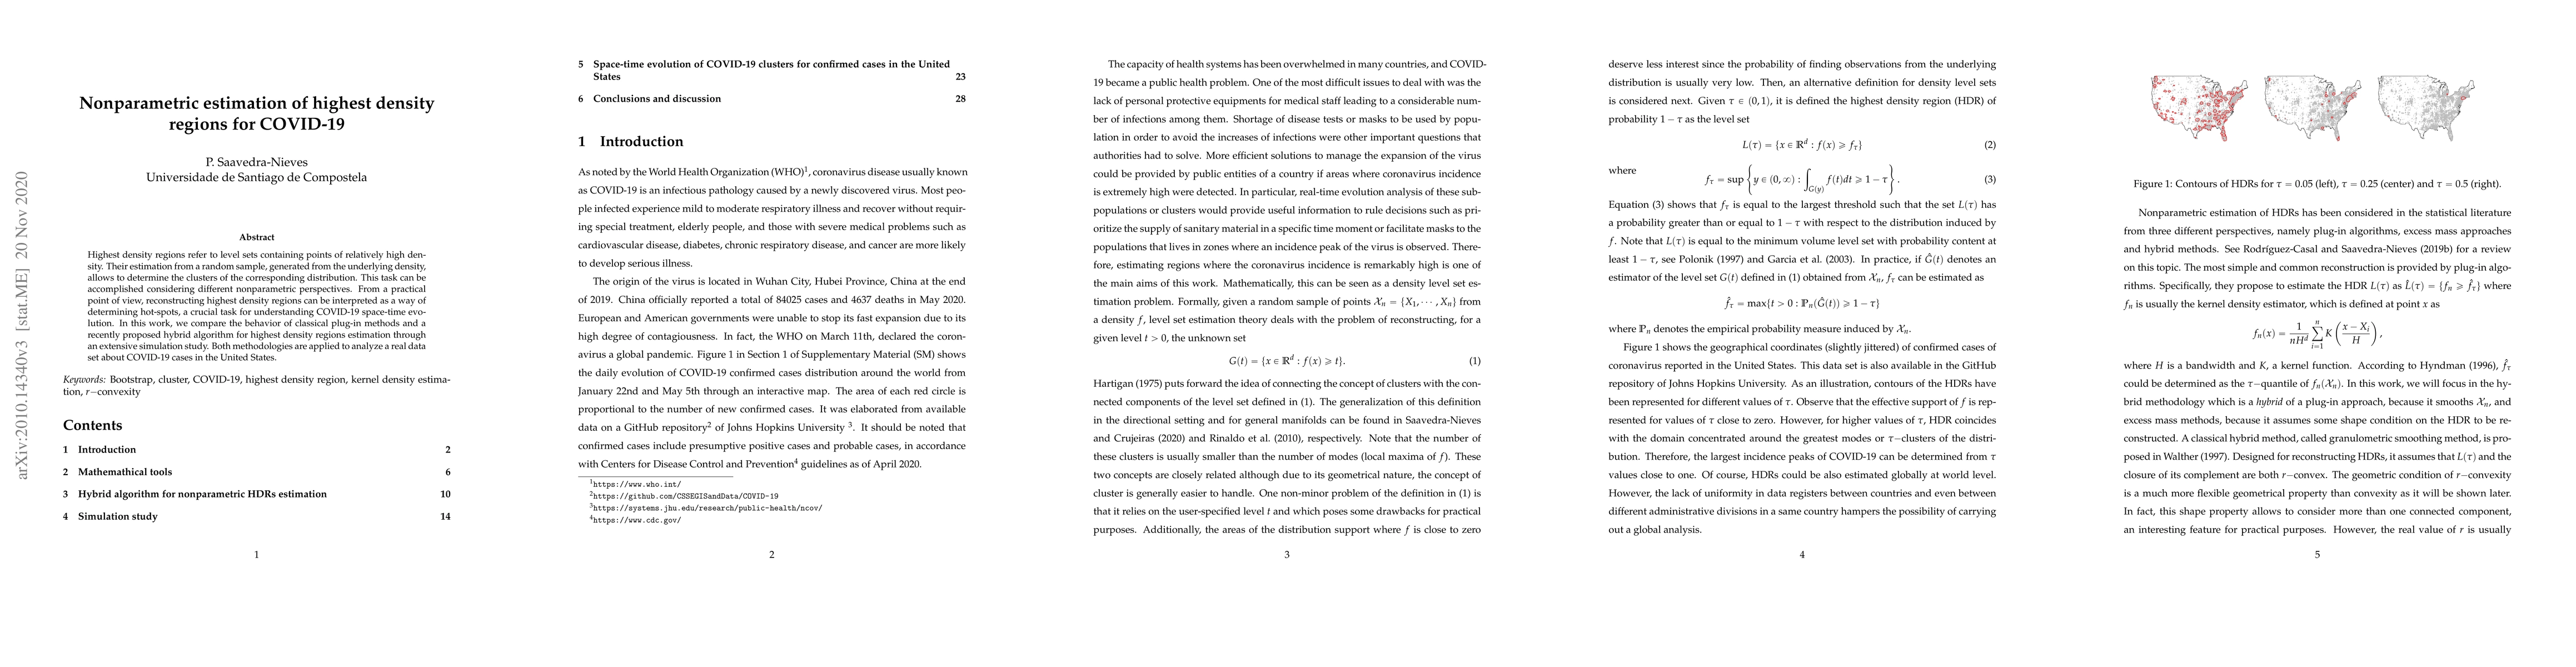
Highest density regions refer to level sets containing points of relatively high density. Their estimation from a random sample, generated from the underlying density, allows to determine the clusters of the corresponding distribution. This task can be accomplished considering different nonparametric perspectives. From a practical point of view, reconstructing highest density regions can be interpreted as a way of determining hot-spots, a crucial task for understanding COVID-19 space-time evolution. In this work, we compare the behavior of classical plug-in methods and a recently proposed hybrid algorithm for highest density regions estimation through an extensive simulation study. Both methodologies are applied to analyze a real data set about COVID-19 cases in the United States.
AI Key Findings
Get AI-generated insights about this paper's methodology, results, significance, and more — seven facets brought into focus.
Impact
Paper Details
Authors
PDF Preview
Key Terms
Citation Network
Current paper (gray), citations (green), references (blue)
Display is limited for performance on very large graphs.
Discussion 0