Authors
Summary
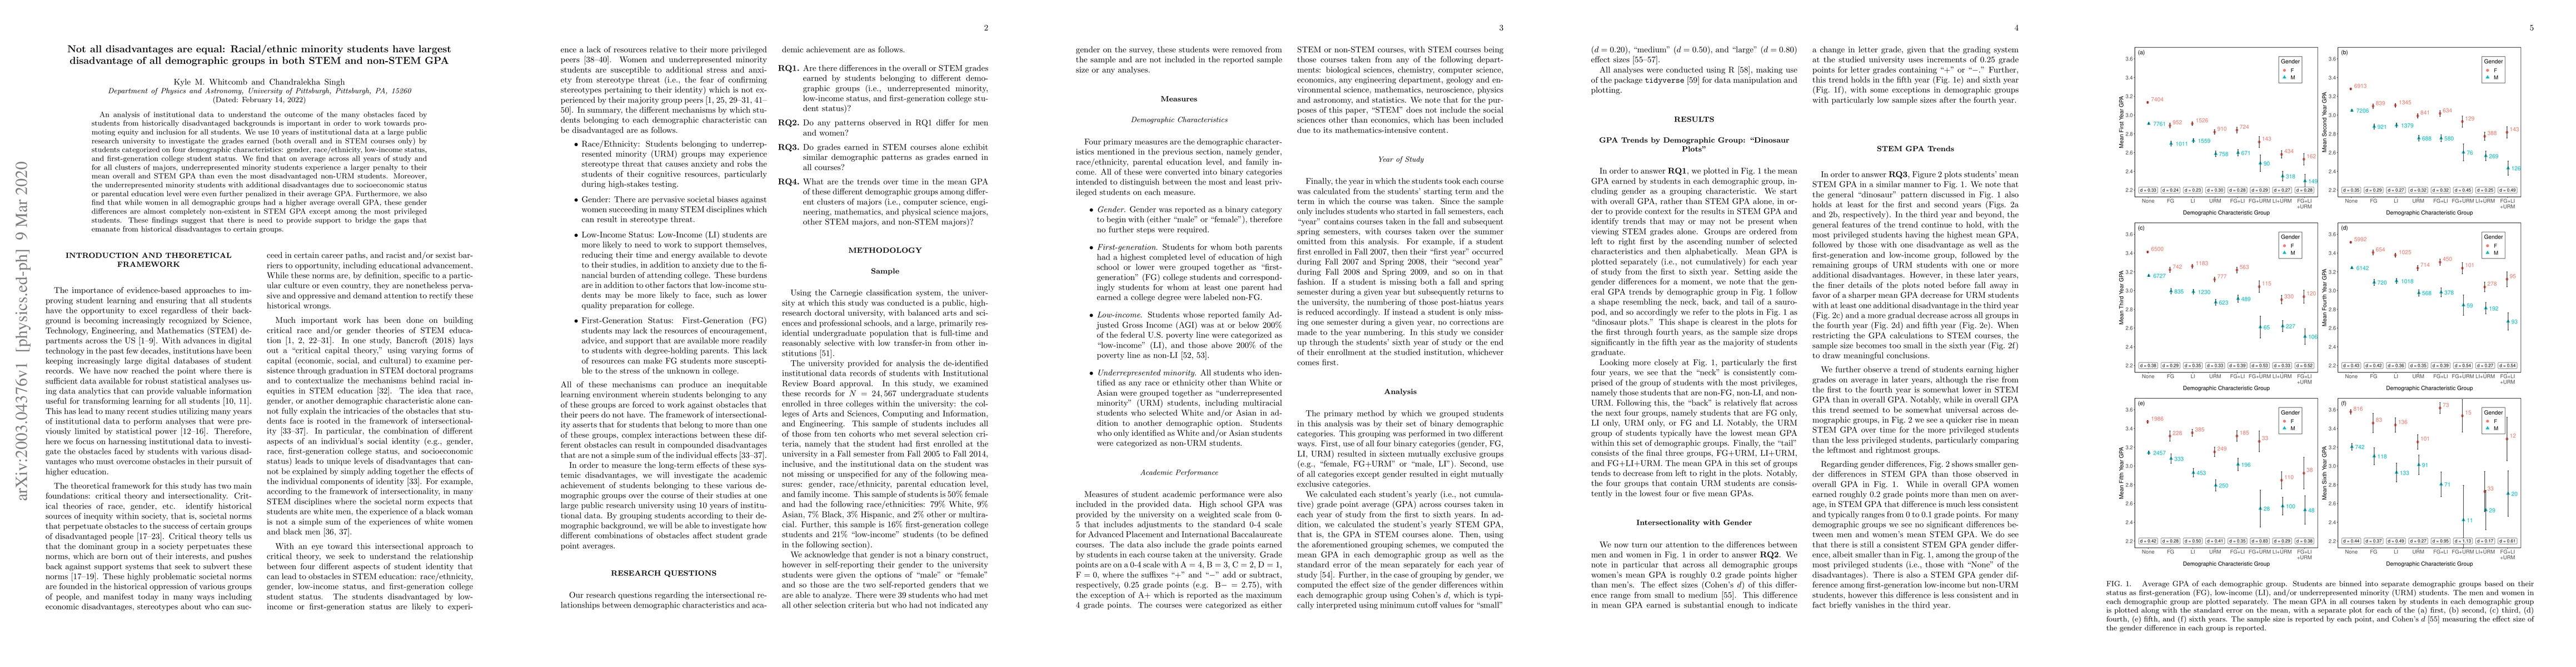
An analysis of institutional data to understand the outcome of the many obstacles faced by students from historically disadvantaged backgrounds is important in order to work towards promoting equity and inclusion for all students. We use 10 years of institutional data at a large public research university to investigate the grades earned (both overall and in STEM courses only) by students categorized on four demographic characteristics: gender, race/ethnicity, low-income status, and first-generation college student status. We find that on average across all years of study and for all clusters of majors, underrepresented minority students experience a larger penalty to their mean overall and STEM GPA than even the most disadvantaged non-URM students. Moreover, the underrepresented minority students with additional disadvantages due to socioeconomic status or parental education level were even further penalized in their average GPA. Furthermore, we also find that while women in all demographic groups had a higher average overall GPA, these gender differences are almost completely non-existent in STEM GPA except among the most privileged students. These findings suggest that there is need to provide support to bridge the gaps that emanate from historical disadvantages to certain groups.
AI Key Findings
Get AI-generated insights about this paper's methodology, results, and significance.
Paper Details
PDF Preview
Key Terms
Citation Network
Current paper (gray), citations (green), references (blue)
Display is limited for performance on very large graphs.
Similar Papers
Found 4 papersRacial and Ethnic Minority Groups, Female Sex, and Tissue Loss are Associated with Increased Risk for Hospital Readmission Following Revascularization for Chronic Limb-Threatening Ischemia.
Ueland, Walker R, Javed, Muhammad J, Spinosa, Michael et al.
Dependency on Meta AI Chatbot in Messenger Among STEM and Non-STEM Students in Higher Education
John Paul P. Miranda, Jaymark A. Yambao, Hilene E. Hernandez et al.
| Title | Authors | Year | Actions |
|---|
Comments (0)