Novel Discrete Composite Distributions with Applications to Infectious Disease Data
Publication
Metrics
AI Quick Summary
This paper proposes novel discrete composite distributions with Pareto tails to better model infectious disease data, addressing the limitations of the traditional Pareto distribution. The new distributions were evaluated using COVID-19 and monkeypox case data, showing competitive performance and providing insights into disease control.
Paper Preview
Abstract
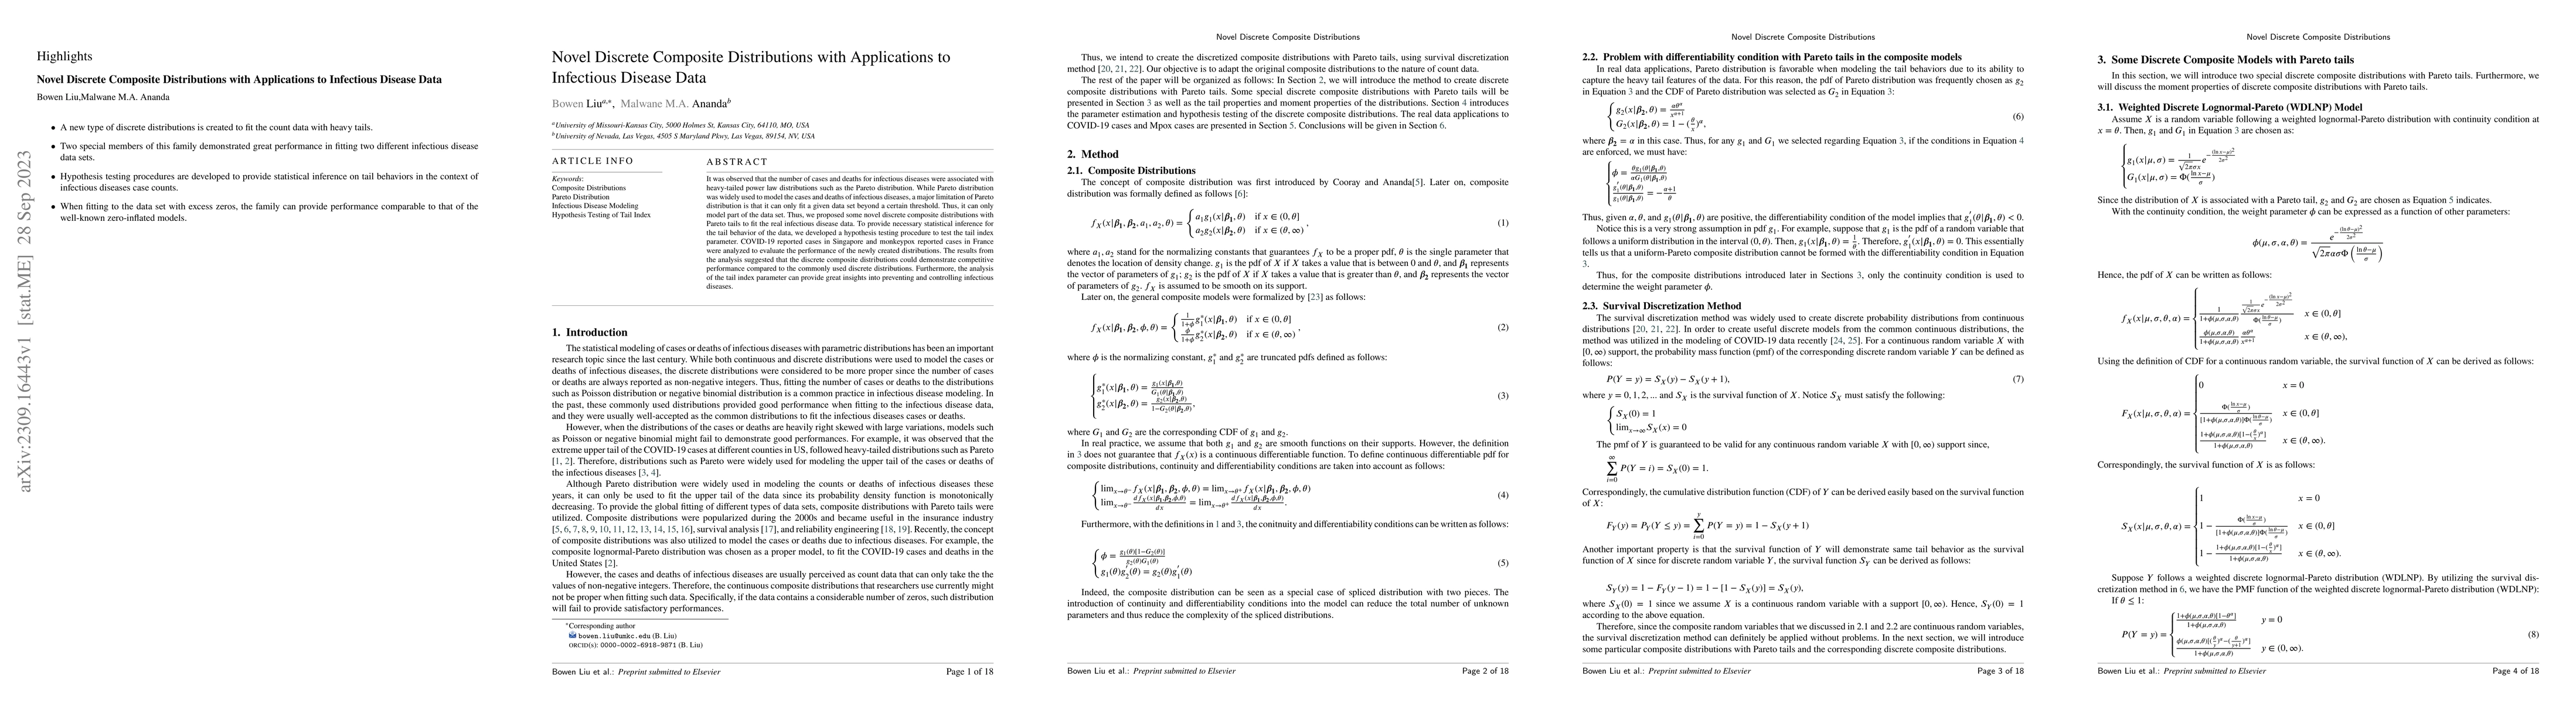
It was observed that the number of cases and deaths for infectious diseases were associated with heavy-tailed power law distributions such as the Pareto distribution. While Pareto distribution was widely used to model the cases and deaths of infectious diseases, a major limitation of Pareto distribution is that it can only fit a given data set beyond a certain threshold. Thus, it can only model part of the data set. Thus, we proposed some novel discrete composite distributions with Pareto tails to fit the real infectious disease data. To provide necessary statistical inference for the tail behavior of the data, we developed a hypothesis testing procedure to test the tail index parameter. COVID-19 reported cases in Singapore and monkeypox reported cases in France were analyzed to evaluate the performance of the newly created distributions. The results from the analysis suggested that the discrete composite distributions could demonstrate competitive performance compared to the commonly used discrete distributions. Furthermore, the analysis of the tail index parameter can provide great insights into preventing and controlling infectious diseases.
AI Key Findings
Get AI-generated insights about this paper's methodology, results, significance, and more — seven facets brought into focus.
Impact
Paper Details
Authors
PDF Preview
Key Terms
Citation Network
Current paper (gray), citations (green), references (blue)
Display is limited for performance on very large graphs.
Discussion 0