Summary
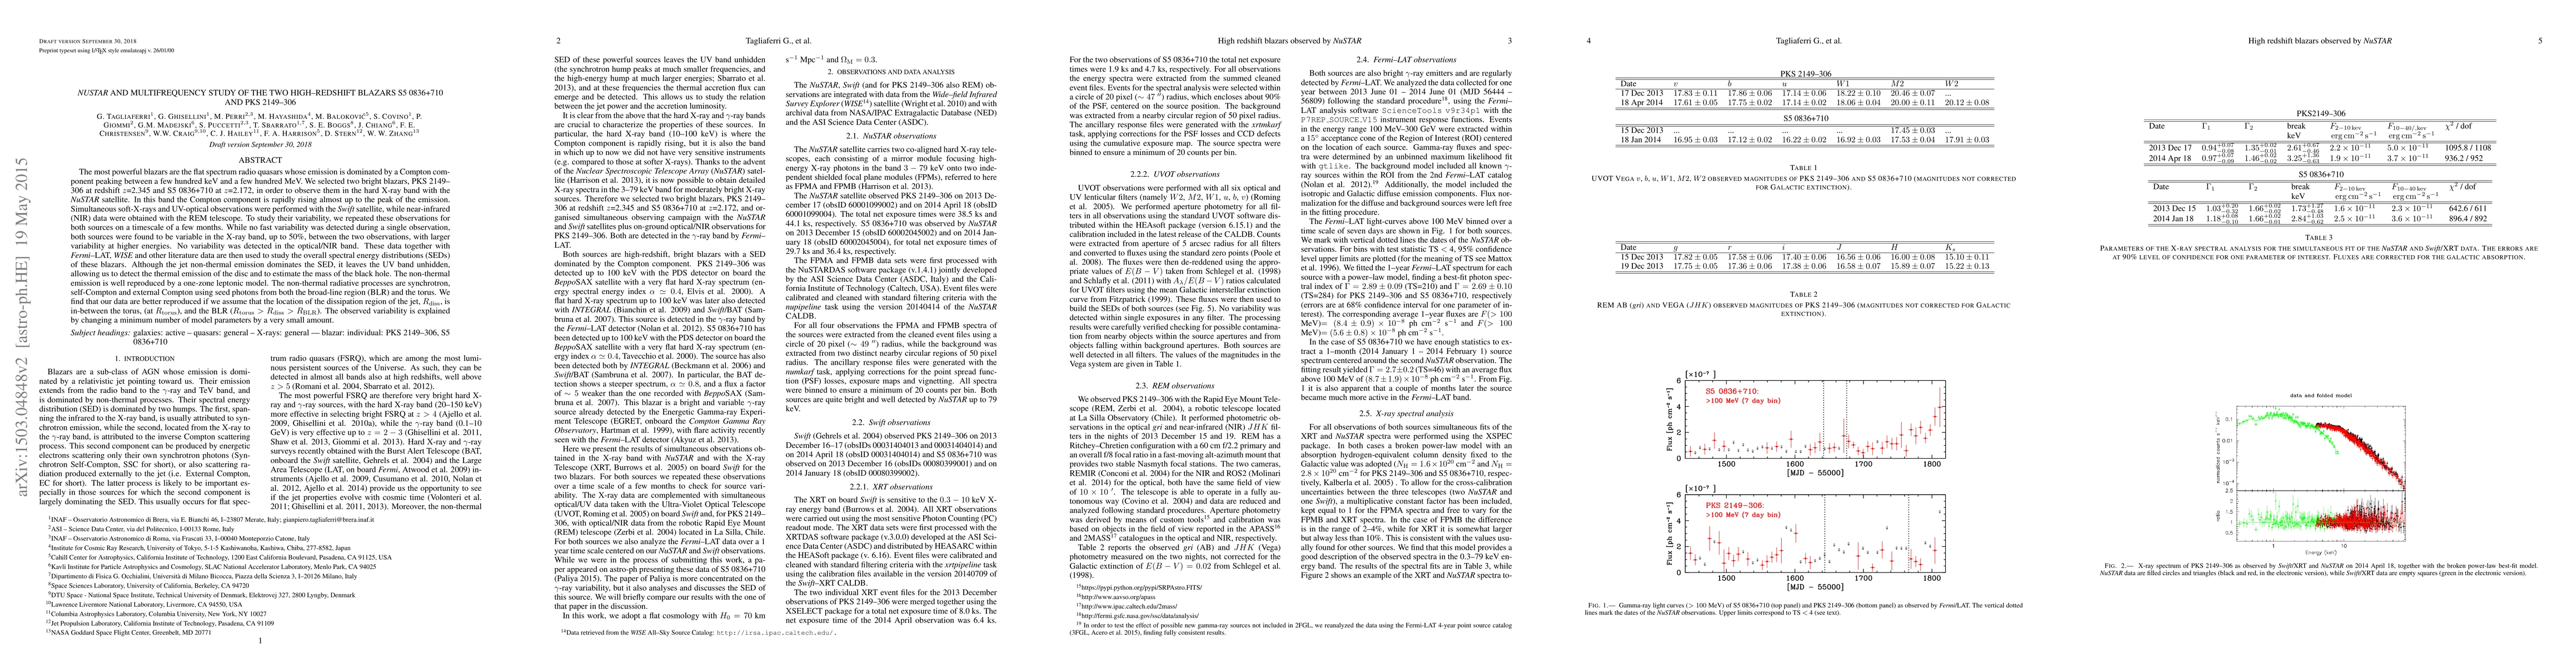
The most powerful blazars are the flat spectrum radio quasars whose emission is dominated by a Compton component peaking between a few hundred keV and a few hundred MeV. We selected two bright blazars, PKS 2149-306 at redshift z=2.345 and S5 0836+710 at z=2.172, in order to observe them in the hard X-ray band with the NuSTAR satellite. In this band the Compton component is rapidly rising almost up to the peak of the emission. Simultaneous soft-X-rays and UV-optical observations were performed with the Swift satellite, while near-infrared (NIR) data were obtained with the REM telescope. To study their variability, we repeated these observations for both sources on a timescale of a few months. While no fast variability was detected during a single observation, both sources were found to be variable in the X-ray band, up to 50%, between the two observations, with larger variability at higher energies. No variability was detected in the optical/NIR band. These data together with Fermi-LAT, WISE and other literature data are then used to study the overall spectral energy distributions (SEDs) of these blazars. Although the jet non-thermal emission dominates the SED, it leaves the UV band unhidden, allowing us to detect the thermal emission of the disc and to estimate the mass of the black hole. The non-thermal emission is well reproduced by a one-zone leptonic model. The non-thermal radiative processes are synchrotron, self-Compton and external Compton using seed photons from both the broad-line region (BLR) and the torus. We find that our data are better reproduced if we assume that the location of the dissipation region of the jet, R_diss, is in-between the torus, (at R_torus), and the BLR (R_torus>R_diss>R_BLR). The observed variability is explained by changing a minimum number of model parameters by a very small amount.
AI Key Findings
Get AI-generated insights about this paper's methodology, results, and significance.
Paper Details
PDF Preview
Key Terms
Citation Network
Current paper (gray), citations (green), references (blue)
Display is limited for performance on very large graphs.
| Title | Authors | Year | Actions |
|---|
Comments (0)