Nviz - A General Purpse Visualization tool for Wireless Sensor Networks
Publication
Metrics
AI Quick Summary
A general-purpose visualization tool called NViz is proposed to represent and visualize data for various Wireless Sensor Networks (WSNs), allowing users to adapt network properties through XML files.
Paper Preview
Abstract
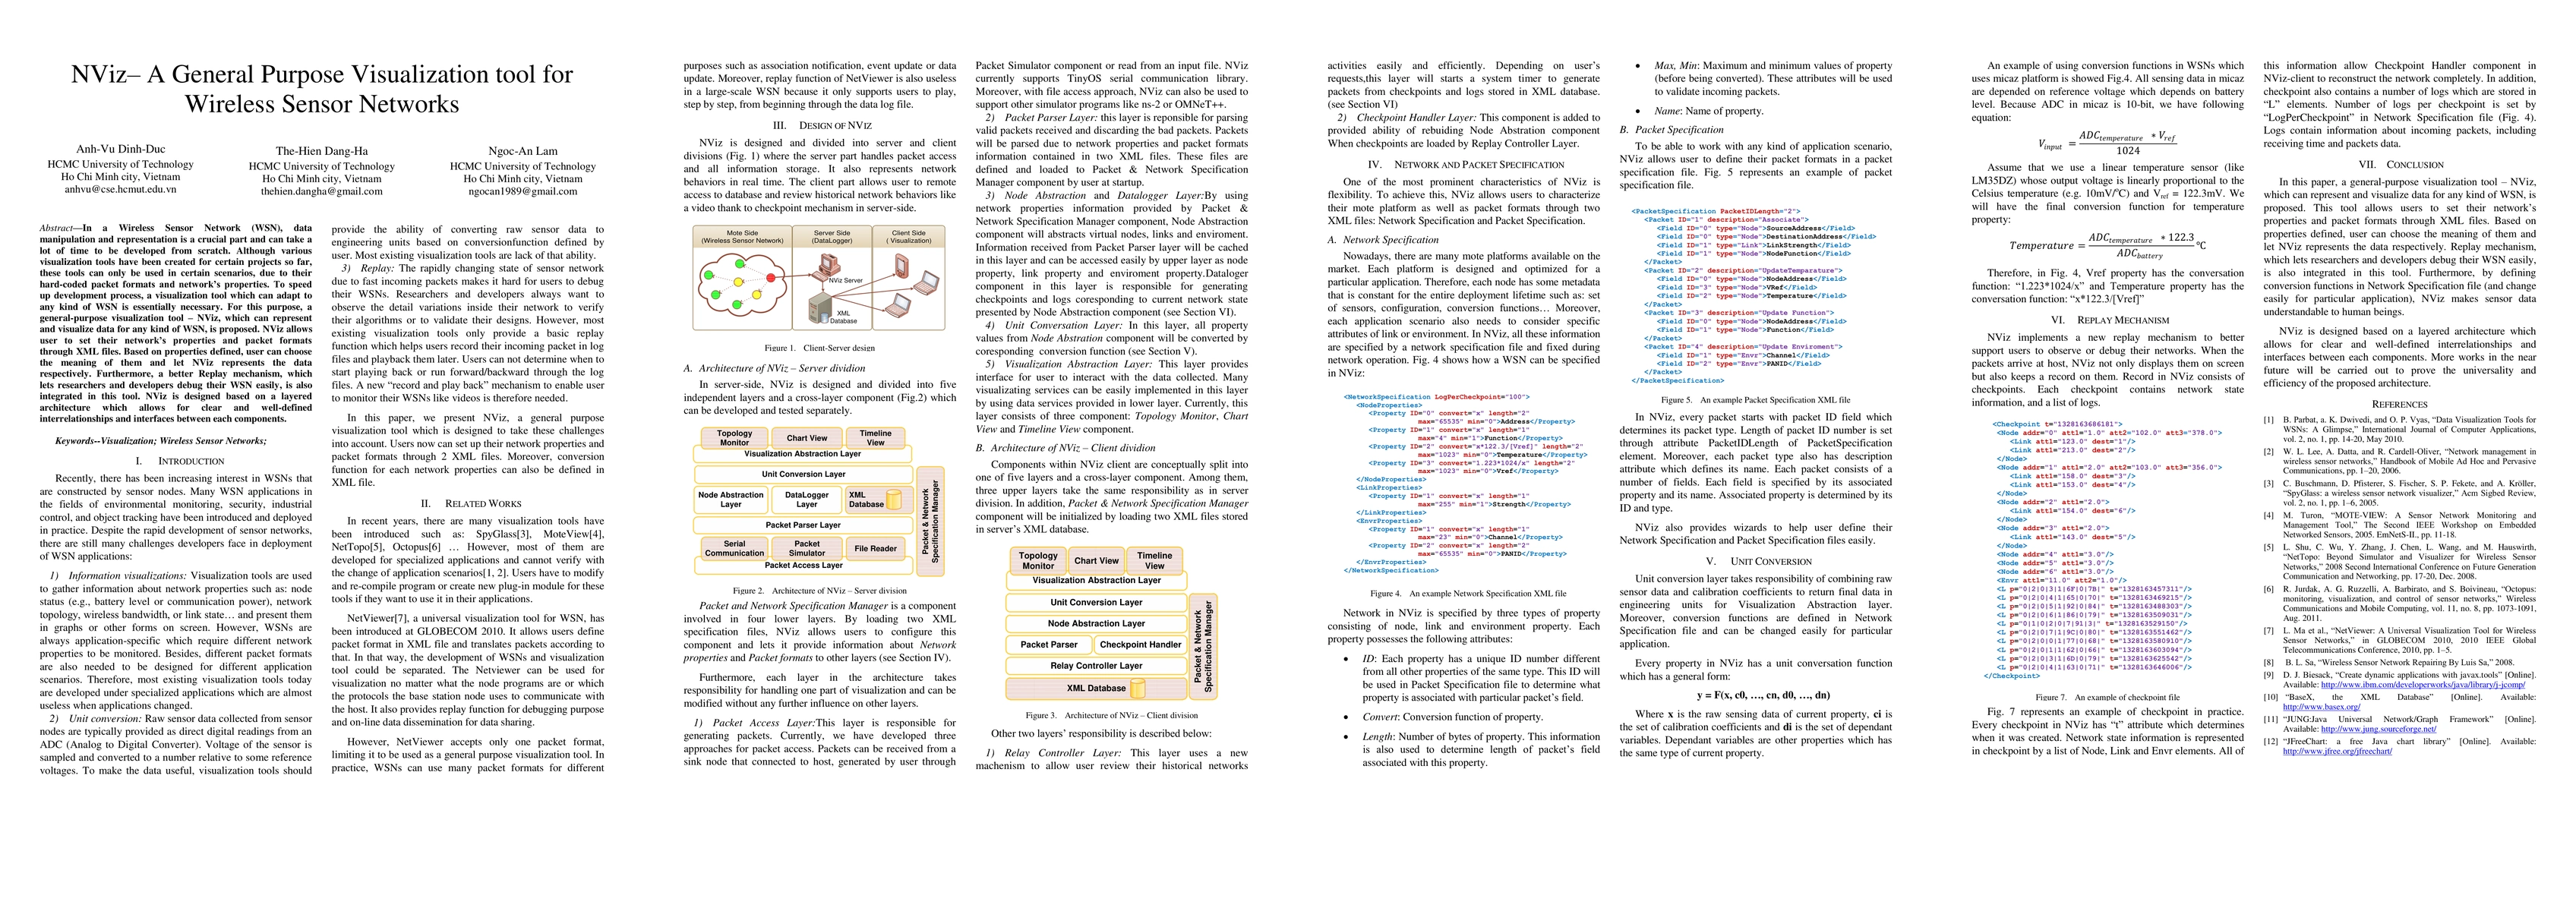
In a Wireless Sensor Network (WSN), data manipulation and representation is a crucial part and can take a lot of time to be developed from scratch. Although various visualization tools have been created for certain projects so far, these tools can only be used in certain scenarios, due to their hard-coded packet formats and network's properties. To speed up the development process, a visualization tool which can adapt to any kind of WSN is essentially necessary. For this purpose, a general-purpose visualization tool - NViz, which can represent and visualize data for any kind of WSN, is proposed. NViz allows users to set their network's properties and packet formats through XML files. Based on properties defined, users can choose the meaning of them and let NViz represents the data respectively. Furthermore, a better Replay mechanism, which lets researchers and developers debug their WSN easily, is also integrated in this tool. NViz is designed based on a layered architecture which allows for clear and well-defined interrelationships and interfaces between each component.
AI Key Findings
Get AI-generated insights about this paper's methodology, results, significance, and more — seven facets brought into focus.
Impact
Paper Details
PDF Preview
Key Terms
Citation Network
Current paper (gray), citations (green), references (blue)
Display is limited for performance on very large graphs.
Discussion 0