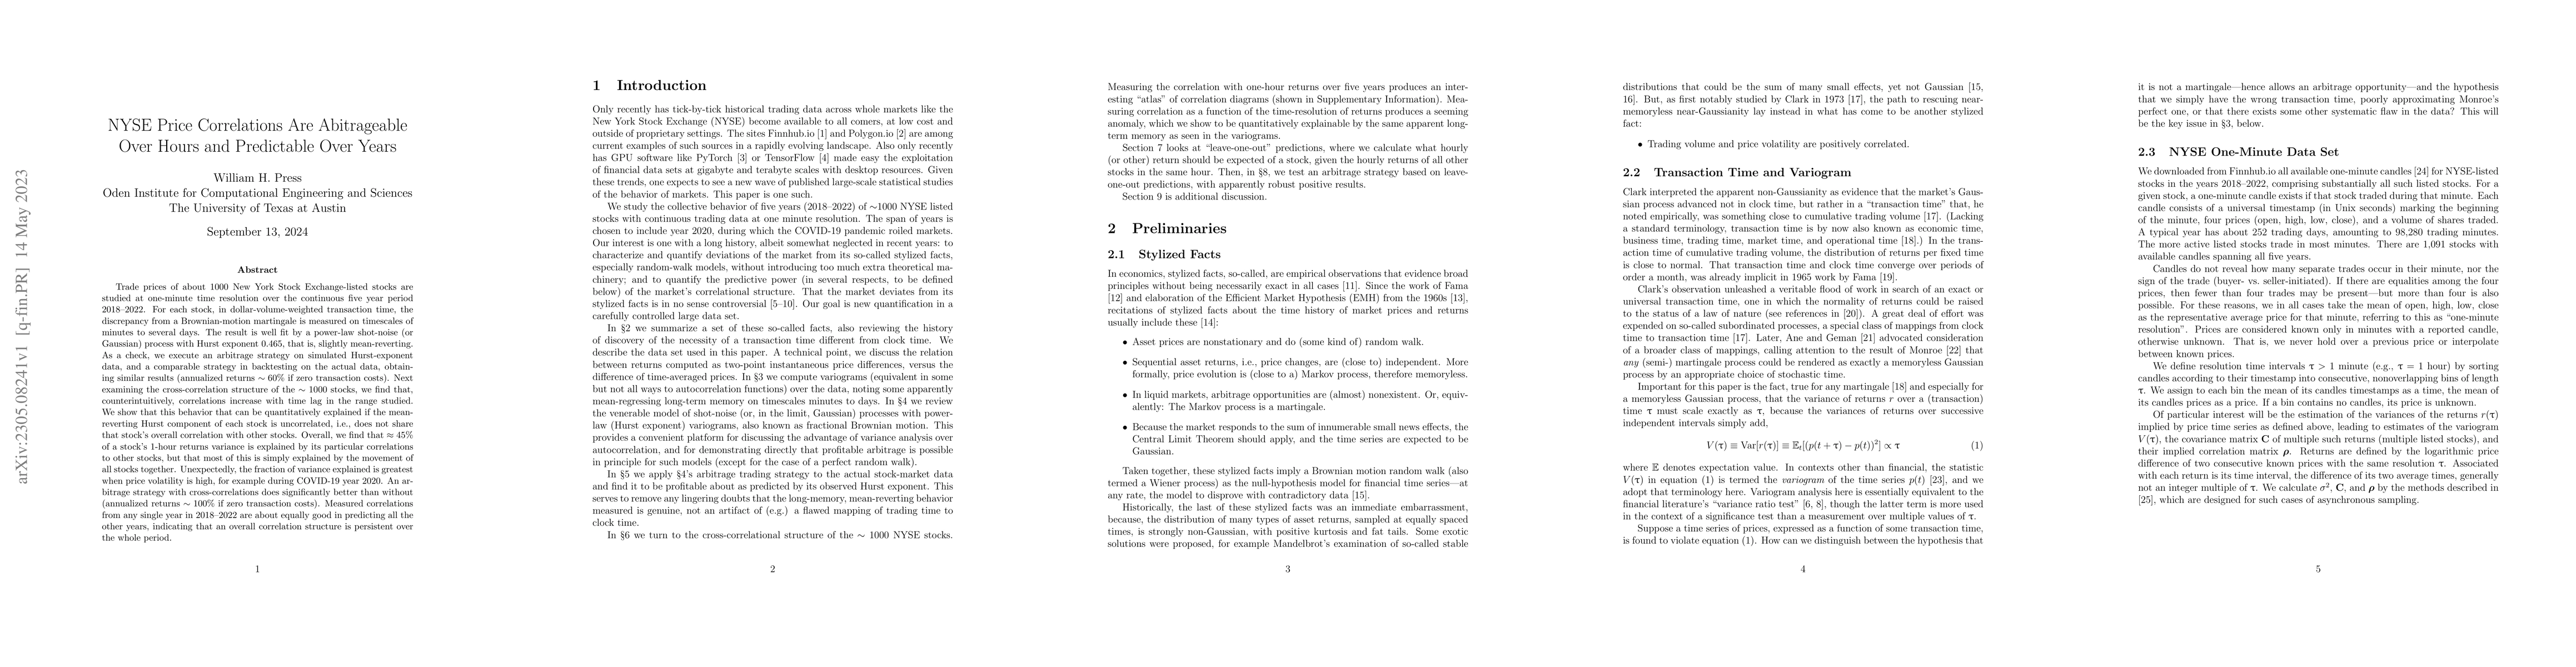
NYSE Price Correlations Are Abitrageable Over Hours and Predictable Over Years
Publication
Metrics
AI Quick Summary
This study investigates the price correlations of 1000 NYSE stocks over five years, finding arbitrage opportunities within hours and predictable cross-correlations over years. The research reveals that despite increasing correlations with time lag, 45% of a stock's hourly return variance is explained by its correlations with others, with higher volatility enhancing this effect.
Paper Preview
Abstract
Trade prices of about 1000 New York Stock Exchange-listed stocks are studied at one-minute time resolution over the continuous five year period 2018--2022. For each stock, in dollar-volume-weighted transaction time, the discrepancy from a Brownian-motion martingale is measured on timescales of minutes to several days. The result is well fit by a power-law shot-noise (or Gaussian) process with Hurst exponent 0.465, that is, slightly mean-reverting. As a check, we execute an arbitrage strategy on simulated Hurst-exponent data, and a comparable strategy in backtesting on the actual data, obtaining similar results (annualized returns $\sim 60$\% if zero transaction costs). Next examining the cross-correlation structure of the $\sim 1000$ stocks, we find that, counterintuitively, correlations increase with time lag in the range studied. We show that this behavior that can be quantitatively explained if the mean-reverting Hurst component of each stock is uncorrelated, i.e., does not share that stock's overall correlation with other stocks. Overall, we find that $\approx 45$\% of a stock's 1-hour returns variance is explained by its particular correlations to other stocks, but that most of this is simply explained by the movement of all stocks together. Unexpectedly, the fraction of variance explained is greatest when price volatility is high, for example during COVID-19 year 2020. An arbitrage strategy with cross-correlations does significantly better than without (annualized returns $\sim 100$\% if zero transaction costs). Measured correlations from any single year in 2018--2022 are about equally good in predicting all the other years, indicating that an overall correlation structure is persistent over the whole period.
AI Key Findings
Get AI-generated insights about this paper's methodology, results, significance, and more — seven facets brought into focus.
Impact
Paper Details
Authors
PDF Preview
Key Terms
Citation Network
Current paper (gray), citations (green), references (blue)
Display is limited for performance on very large graphs.
Discussion 0