Summary
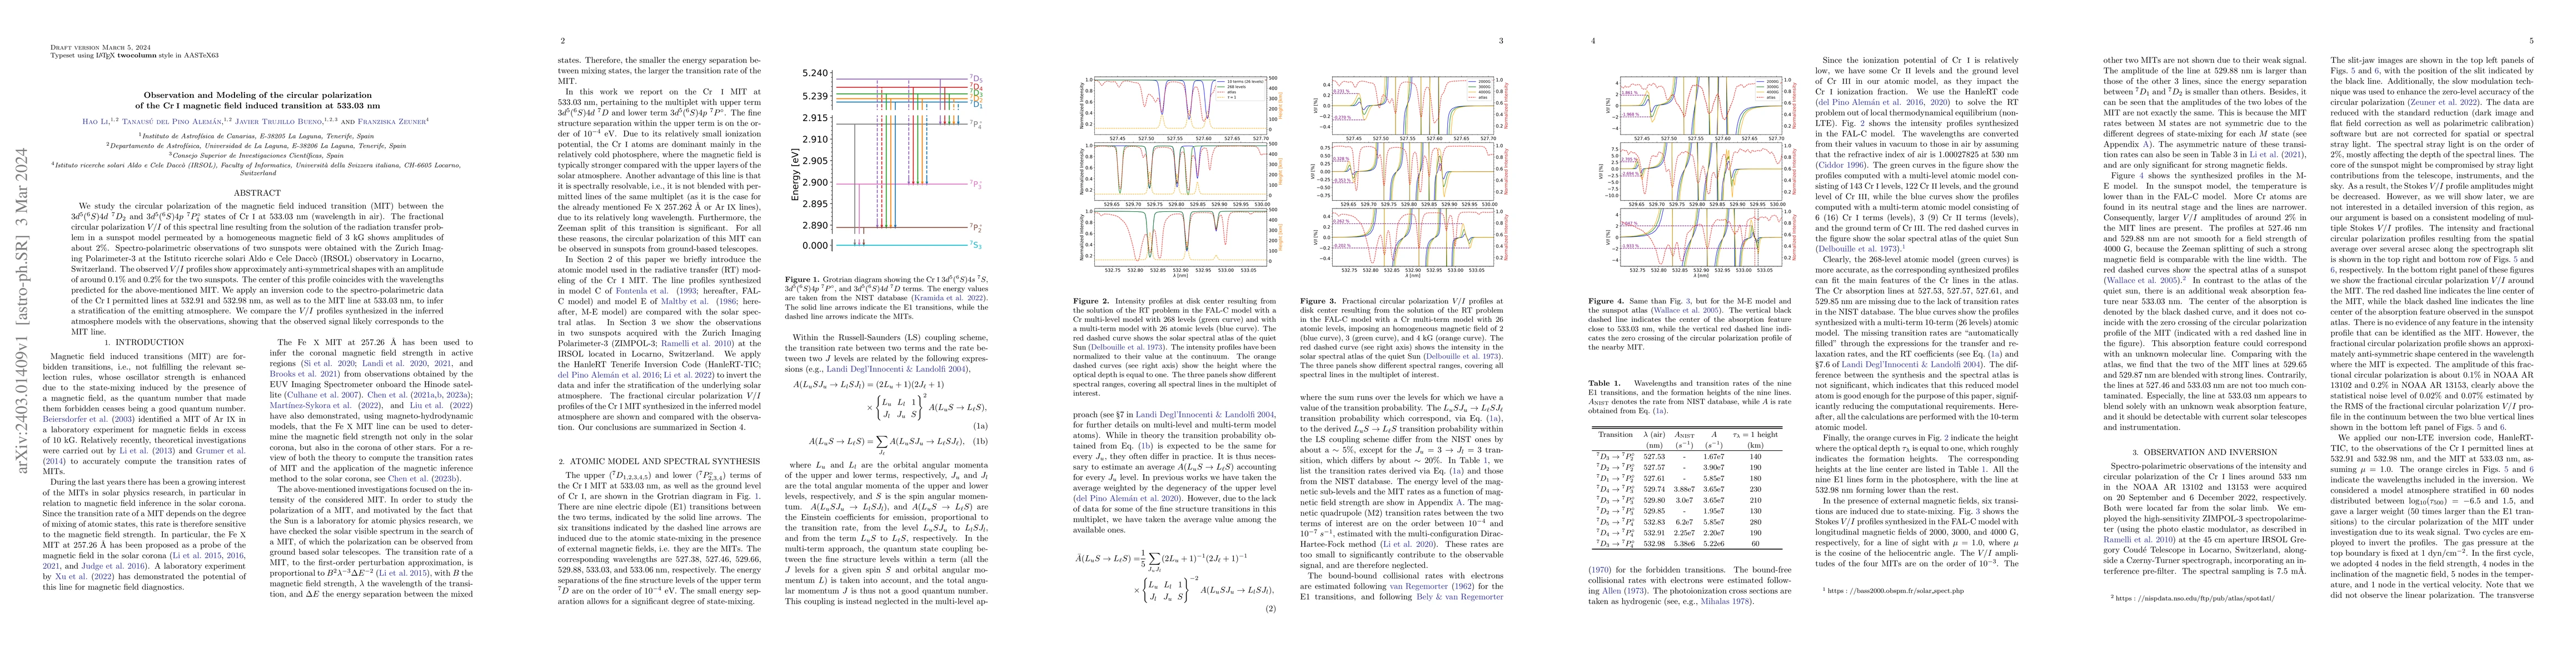
We study the circular polarization of the magnetic field induced transition (MIT) between the $3d^5(^6S)4d\ ^7D_2$ and $3d^5(^6S)4p\ ^7P_4^\circ$ states of \ion{Cr}{1} at 533.03~nm (wavelength in air). The fractional circular polarization $V/I$ of this spectral line resulting from the solution of the radiation transfer problem in a sunspot model permeated by a homogeneous magnetic field of 3~kG shows amplitudes of about $2\%$. Spectro-polarimetric observations of two sunspots were obtained with the Zurich Imaging Polarimeter-3 at the Istituto ricerche solari Aldo e Cele Dacc\`o (IRSOL) observatory observatory in Locarno, Switzerland. The observed $V/I$ profiles show approximately anti-symmetrical shapes with an amplitude of around $0.1\%$ and $0.2\%$ for the two sunspots. The center of this profile coincides with the wavelengths predicted for the above-mentioned MIT. We apply an inversion code to the spectro-polarimetric data of the \ion{Cr}{1} permitted lines at 532.91 and 532.98~nm, as well as to the MIT line at 533.03~nm, to infer a stratification of the emitting atmosphere. We compare the $V/I$ profiles synthesized in the inferred atmosphere models with the observations, showing that the observed signal likely corresponds to the MIT line.
AI Key Findings
Get AI-generated insights about this paper's methodology, results, and significance.
Paper Details
PDF Preview
Key Terms
Citation Network
Current paper (gray), citations (green), references (blue)
Display is limited for performance on very large graphs.
Similar Papers
Found 4 papersThe circular polarization of the Mn I resonance lines around 280 nm for exploring chromospheric magnetism
Tanausú del Pino Alemán, Ernest Alsina Ballester, Javier Trujillo Bueno
Revealing magnetic field structure at the surfaces of protoplanetary disks via near-infrared circular polarization
Ryo Tazaki, Ilse de Langen
No citations found for this paper.
Comments (0)