Publication
Metrics
Paper Preview
Abstract
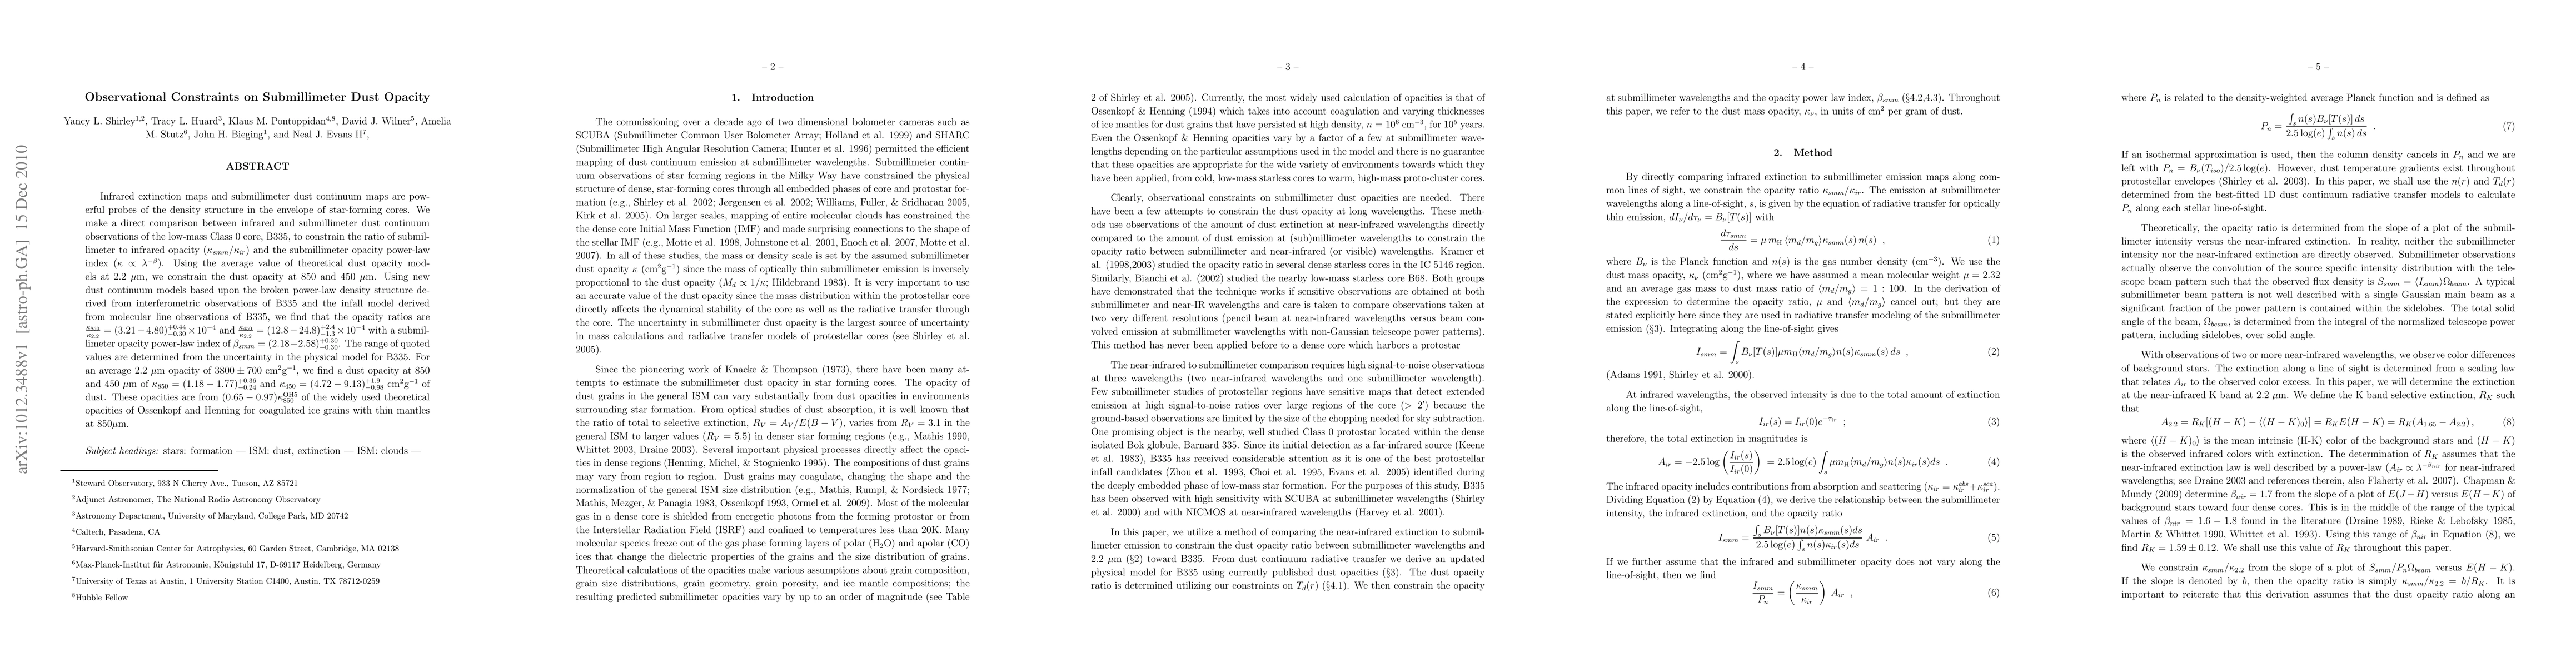
Infrared extinction maps and submillimeter dust continuum maps are powerful probes of the density structure in the envelope of star-forming cores. We make a direct comparison between infrared and submillimeter dust continuum observations of the low-mass Class 0 core, B335, to constrain the ratio of submillimeter to infrared opacity (\kaprat) and the submillimeter opacity power-law index ($\kappa \propto \lambda^{-\beta}$). Using the average value of theoretical dust opacity models at 2.2 \micron, we constrain the dust opacity at 850 and 450 \micron . Using new dust continuum models based upon the broken power-law density structure derived from interferometric observations of B335 and the infall model derived from molecular line observations of B335, we find that the opacity ratios are $\frac{\kappa_{850}}{\kappa_{2.2}} = (3.21 - 4.80)^{+0.44}_{-0.30} \times 10^{-4}$ and $\frac{\kappa_{450}}{\kappa_{2.2}} = (12.8 - 24.8)^{+2.4}_{-1.3} \times 10^{-4}$ with a submillimeter opacity power-law index of $\beta_{smm} = (2.18 - 2.58)^{+0.30}_{-0.30}$. The range of quoted values are determined from the uncertainty in the physical model for B335. For an average 2.2 \micron\ opacity of $3800 \pm 700$ cm$^2$g$^{-1}$, we find a dust opacity at 850 and 450 \micron\ of $\kappa_{850} = (1.18 - 1.77)^{+0.36}_{-0.24}$ and $\kappa_{450} = (4.72 - 9.13)^{+1.9}_{-0.98}$ cm$^2$g$^{-1}$ of dust. These opacities are from $(0.65 - 0.97) \kappa^{\rm{OH}5}_{850}$ of the widely used theoretical opacities of Ossenkopf and Henning for coagulated ice grains with thin mantles at 850\micron.
AI Key Findings
Get AI-generated insights about this paper's methodology, results, significance, and more — seven facets brought into focus.
Impact
Paper Details
PDF Preview
Key Terms
Citation Network
Current paper (gray), citations (green), references (blue)
Display is limited for performance on very large graphs.
Discussion 0