Publication
Metrics
Quick Actions
AI Quick Summary
Researchers used high-resolution spectrophotometry to study Ellerman bombs, finding a 'hot spot' model that matches observed emission spectra, suggesting compact microflares in the lower solar atmosphere.
Paper Preview
Abstract
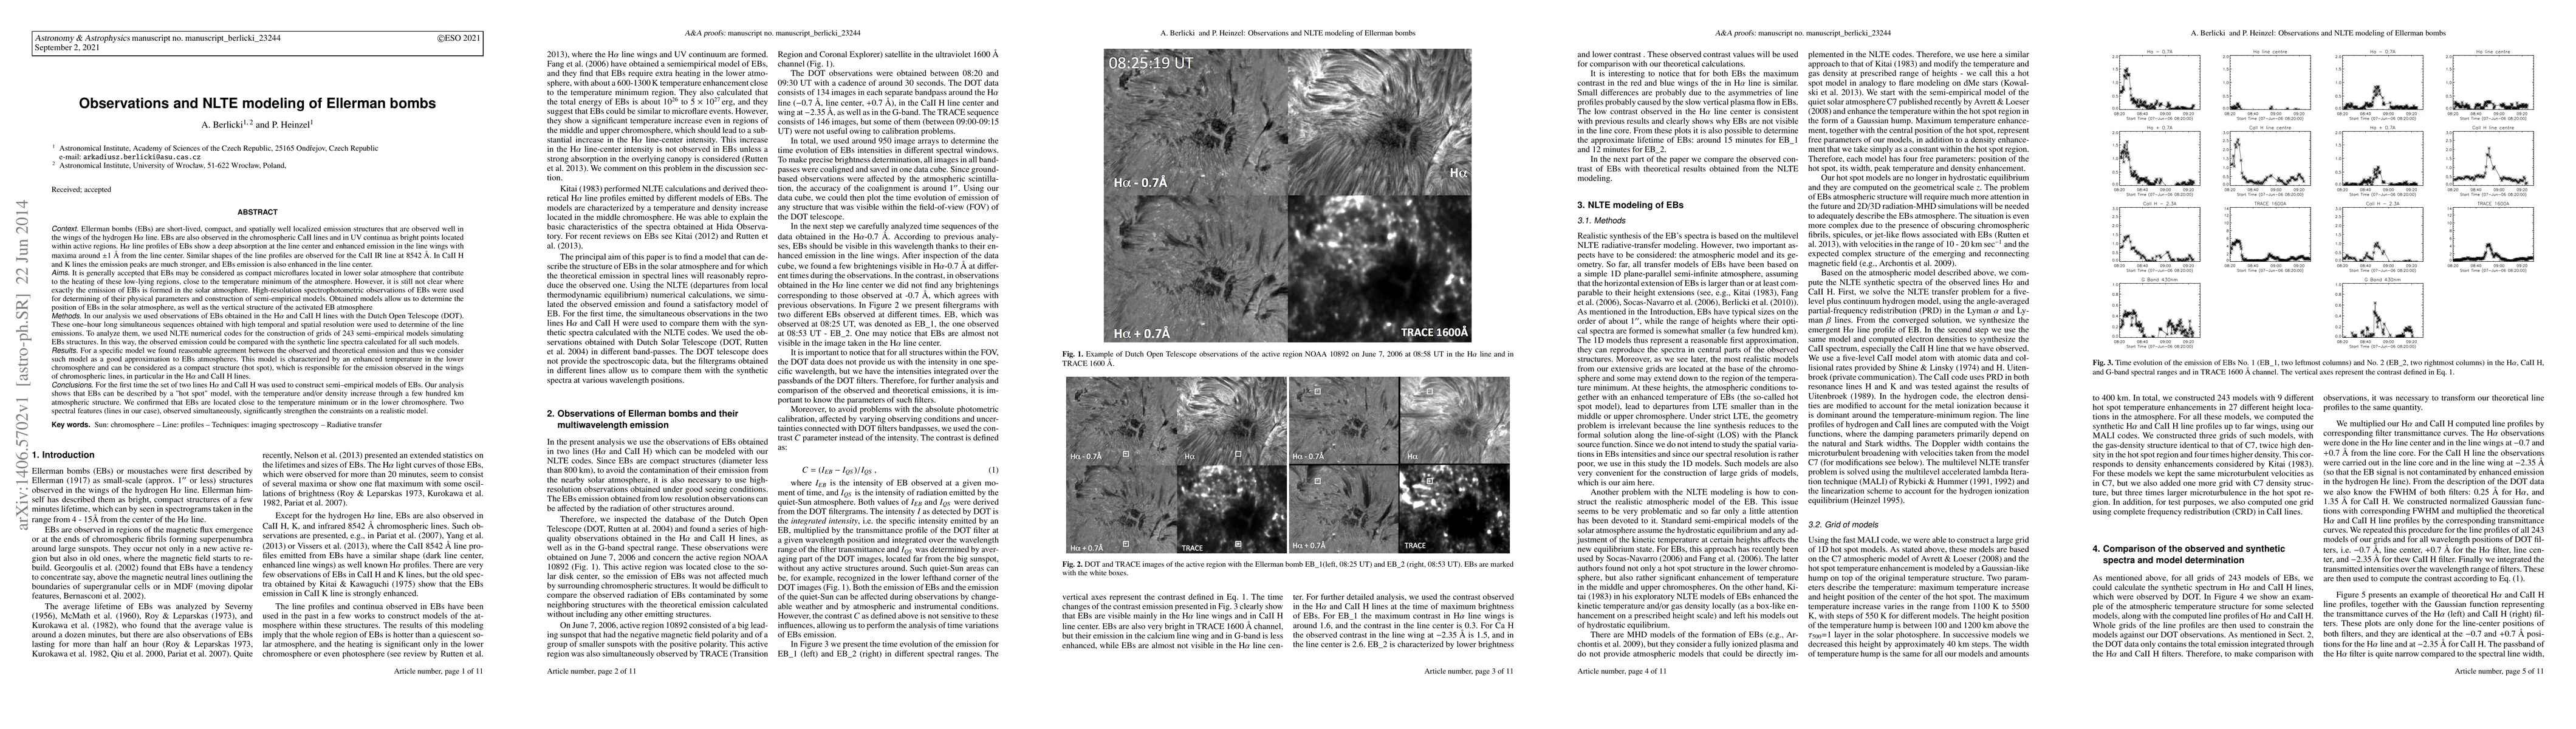
Ellerman bombs (EBs) are short-lived and compact structures that are observed well in the wings of the hydrogen H-alpha line. EBs are also observed in the chromospheric CaII lines and in UV continua. H-alpha line profiles of EBs show a deep absorption at the line center and enhanced emission in the line wings. Similar shapes of the line profiles are observed for the CaII IR line at 8542 ang. It is generally accepted that EBs may be considered as compact microflares located in lower solar atmosphere. However, it is still not clear where exactly the emission of EBs is formed in the solar atmosphere. High-resolution spectrophotometric observations of EBs were used for determining of their physical parameters and construction of semi-empirical models. In our analysis we used observations of EBs obtained in the H-alpha and CaII H lines. We also used NLTE numerical codes for the construction of grids of 243 semi-empirical models simulating EBs structures. In this way, the observed emission could be compared with the calculated line spectra. For a specific model we found reasonable agreement between the observed and theoretical emission and thus we consider such model as a good approximation of the EBs atmospheres. This model is characterized by an enhanced temperature in the lower chromosphere and can be considered as a compact structure (hot spot). For the first time the set of two lines H-alpha and CaII H was used to construct semi-empirical models of EBs. Our analysis shows that EBs can be described by a "hot spot" model, with the temperature and/or density increase through a few hundred km atmospheric structure. We confirmed that EBs are located close to the temperature minimum or in the lower chromosphere. Two spectral features, observed simultaneously, significantly strengthen the constraints on a realistic model.
AI Key Findings
Get AI-generated insights about this paper's methodology, results, and significance.
Paper Details
How to Cite This Paper
@article{anon2015observations,
  title         = {Observations and NLTE modeling of Ellerman bombs},
  year          = {2015},
  eprint        = {1406.5702},
  archivePrefix = {arXiv},
  primaryClass  = {astro-ph.SR},
  doi           = {10.1051/0004-6361/201323244},
}(2015). Observations and NLTE modeling of Ellerman bombs. arXiv. https://doi.org/10.1051/0004-6361/201323244"Observations and NLTE modeling of Ellerman bombs." arXiv, 2015, doi.org/10.1051/0004-6361/201323244.PDF Preview
Key Terms
Citation Network
Current paper (gray), citations (green), references (blue)
Display is limited for performance on very large graphs.
Similar Papers
Found 4 papers| Title | Authors | Year | Actions |
|---|
Comments (0)