Summary
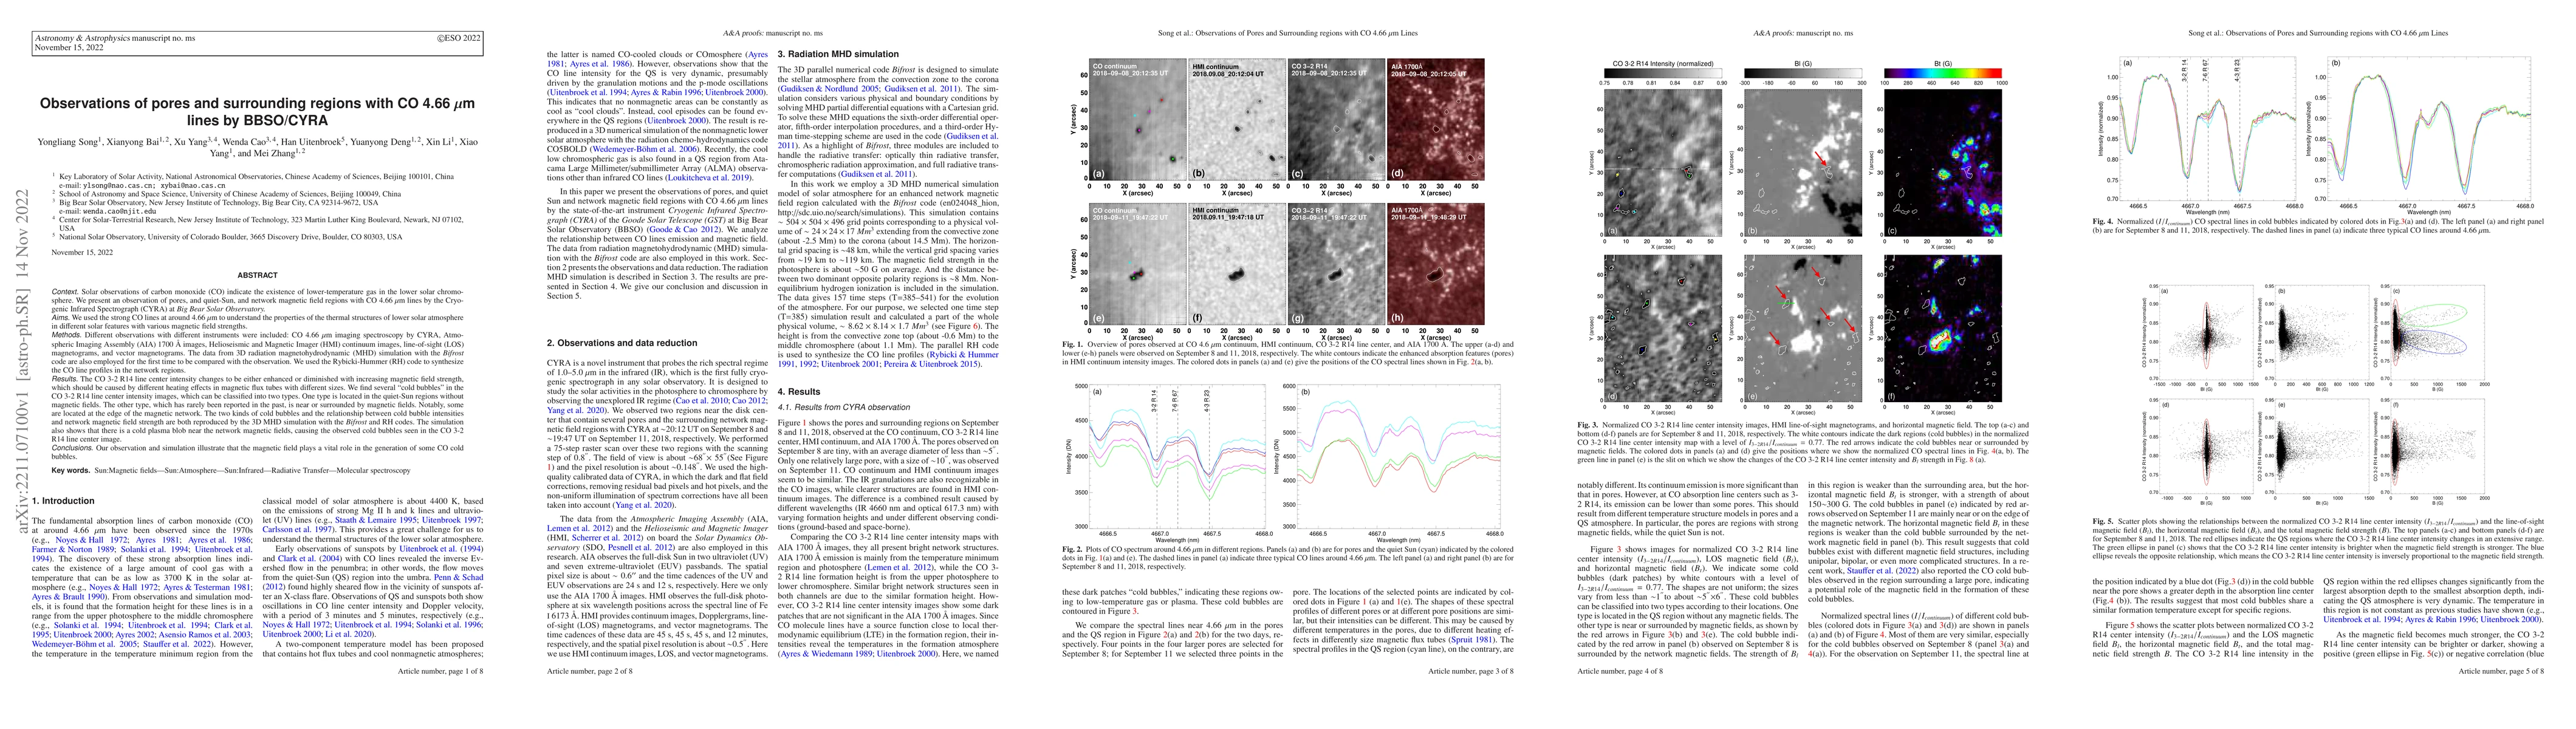
Solar observations of carbon monoxide (CO) indicate the existence of lower-temperature gas in the lower solar chromosphere. We present an observation of pores, and quiet-Sun, and network magnetic field regions with CO 4.66 {\mu}m lines by the Cryogenic Infrared Spectrograph (CYRA) at Big Bear Solar Observatory. We used the strong CO lines at around 4.66 {\mu}m to understand the properties of the thermal structures of lower solar atmosphere in different solar features with various magnetic field strengths. AIA 1700 {\AA} images, HMI continuum images and magnetograms are also included in the observation. The data from 3D radiation magnetohydrodynamic (MHD) simulation with the Bifrost code are also employed for the first time to be compared with the observation. We used the RH code to synthesize the CO line profiles in the network regions. The CO 3-2 R14 line center intensity changes to be either enhanced or diminished with increasing magnetic field strength, which should be caused by different heating effects in magnetic flux tubes with different sizes. We find several "cold bubbles" in the CO 3-2 R14 line center intensity images, which can be classified into two types. One type is located in the quiet-Sun regions without magnetic fields. The other type, which has rarely been reported in the past, is near or surrounded by magnetic fields. Notably, some are located at the edge of the magnetic network. The two kinds of cold bubbles and the relationship between cold bubble intensities and network magnetic field strength are both reproduced by the 3D MHD simulation with the Bifrost and RH codes. The simulation also shows that there is a cold plasma blob near the network magnetic fields, causing the observed cold bubbles seen in the CO 3-2 R14 line center image. Our observation and simulation illustrate that the magnetic field plays a vital role in the generation of some CO cold bubbles.
AI Key Findings
Get AI-generated insights about this paper's methodology, results, and significance.
Paper Details
PDF Preview
Key Terms
Citation Network
Current paper (gray), citations (green), references (blue)
Display is limited for performance on very large graphs.
No citations found for this paper.
Comments (0)