Publication
Metrics
AI Quick Summary
This study investigates 5-minute umbral oscillations in a sunspot using spectral data from TiO, H$\alpha$, and 304 \AA{}, identifying running penumbral waves (RPWs) with phase speeds exceeding 4 km s$^{-1}$. The research reveals that 3-minute umbral oscillatory events emerge from RPWs, suggesting a complex interaction between magnetic field structures and wave propagation in sunspot regions.
Paper Preview
Abstract
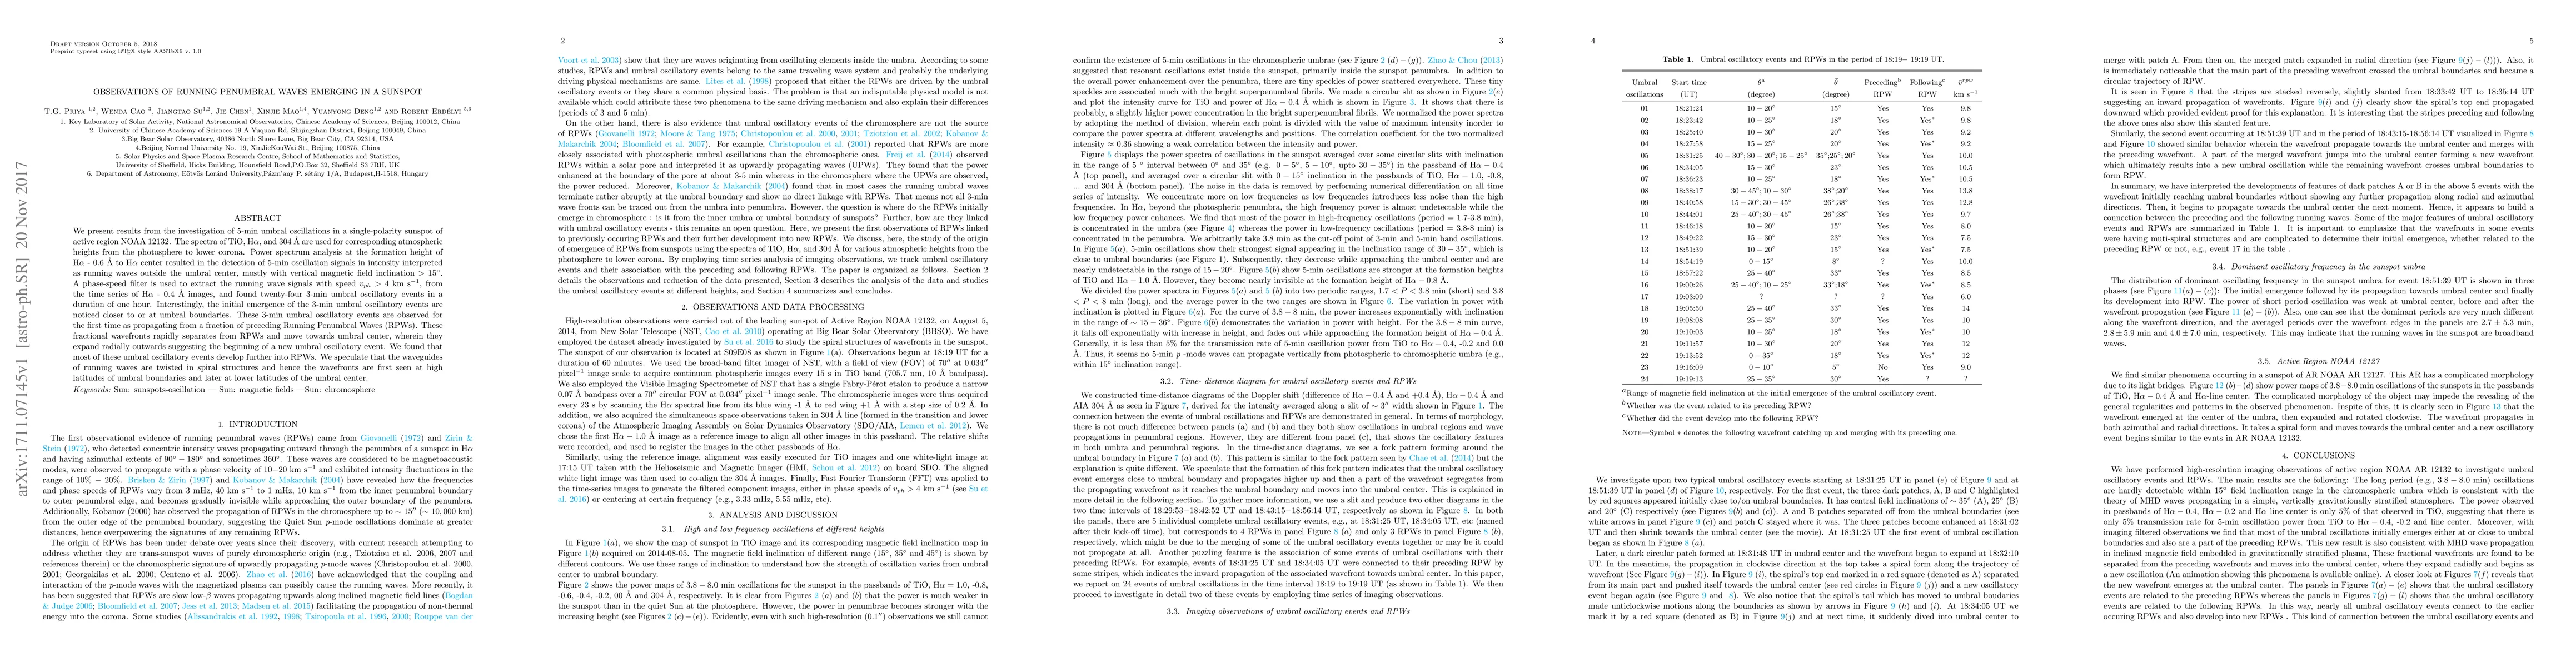
We present results from the investigation of 5-min umbral oscillations in a single-polarity sunspot of active region NOAA 12132. The spectra of TiO, H$\alpha$, and 304 \AA{} are used for corresponding atmospheric heights from the photosphere to lower corona. Power spectrum analysis at the formation height of H$\alpha$ - 0.6 \AA{} to H$\alpha$ center resulted in the detection of 5-min oscillation signals in intensity interpreted as running waves outside the umbral center, mostly with vertical magnetic field inclination $>15\deg$. A phase-speed filter is used to extract the running wave signals with speed $v_{ph}> 4$ km s$^{-1}$, from the time series of H$\alpha$ - 0.4 \AA{} images, and found twenty-four 3-min umbral oscillatory events in a duration of one hour. Interestingly, the initial emergence of the 3-min umbral oscillatory events are noticed closer to or at umbral boundaries. These 3-min umbral oscillatory events are observed for the first time as propagating from a fraction of preceding Running Penumbral Waves (RPWs). These fractional wavefronts rapidly separates from RPWs and move towards umbral center, wherein they expand radially outwards suggesting the beginning of a new umbral oscillatory event. We found that most of these umbral oscillatory events develop further into RPWs. We speculate that the waveguides of running waves are twisted in spiral structures and hence the wavefronts are first seen at high latitudes of umbral boundaries and later at lower latitudes of the umbral center.
AI Key Findings
Get AI-generated insights about this paper's methodology, results, significance, and more — seven facets brought into focus.
Impact
Paper Details
PDF Preview
Key Terms
Citation Network
Current paper (gray), citations (green), references (blue)
Display is limited for performance on very large graphs.
Discussion 0