Ocean Mover's Distance: Using Optimal Transport for Analyzing Oceanographic Data
Publication
Metrics
AI Quick Summary
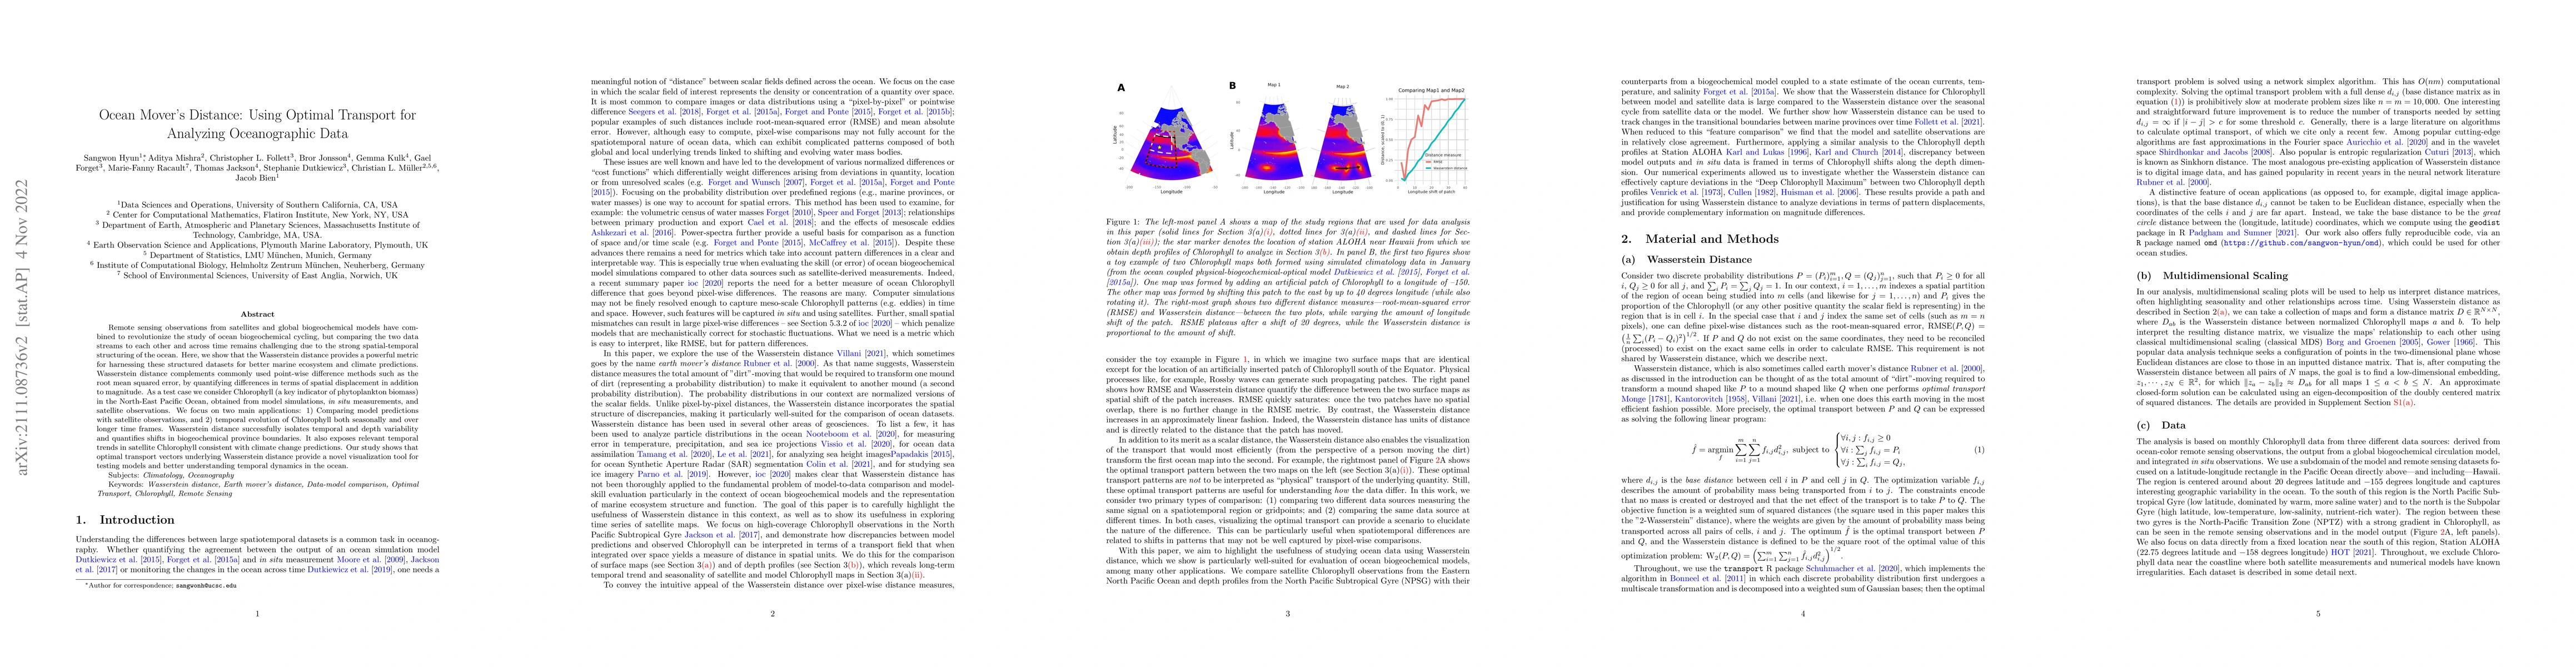
This paper introduces the Wasserstein distance for analyzing oceanographic data, demonstrating its effectiveness in comparing satellite observations and biogeochemical models. It highlights how this metric captures spatial displacements and temporal trends, offering insights into phytoplankton biomass and climate change impacts in the North-East Pacific Ocean.
Paper Preview
Abstract
Remote sensing observations from satellites and global biogeochemical models have combined to revolutionize the study of ocean biogeochemical cycling, but comparing the two data streams to each other and across time remains challenging due to the strong spatial-temporal structuring of the ocean. Here, we show that the Wasserstein distance provides a powerful metric for harnessing these structured datasets for better marine ecosystem and climate predictions. Wasserstein distance complements commonly used point-wise difference methods such as the root mean squared error, by quantifying differences in terms of spatial displacement in addition to magnitude. As a test case we consider Chlorophyll (a key indicator of phytoplankton biomass) in the North-East Pacific Ocean, obtained from model simulations, in situ measurements, and satellite observations. We focus on two main applications: 1) Comparing model predictions with satellite observations, and 2) temporal evolution of Chlorophyll both seasonally and over longer time frames. Wasserstein distance successfully isolates temporal and depth variability and quantifies shifts in biogeochemical province boundaries. It also exposes relevant temporal trends in satellite Chlorophyll consistent with climate change predictions. Our study shows that optimal transport vectors underlying Wasserstein distance provide a novel visualization tool for testing models and better understanding temporal dynamics in the ocean.
AI Key Findings
Get AI-generated insights about this paper's methodology, results, significance, and more — seven facets brought into focus.
Impact
Paper Details
Authors
PDF Preview
Key Terms
Citation Network
Current paper (gray), citations (green), references (blue)
Display is limited for performance on very large graphs.
Discussion 0