ODVICE: An Ontology-Driven Visual Analytic Tool for Interactive Cohort Extraction
Publication
Metrics
Paper Preview
Abstract
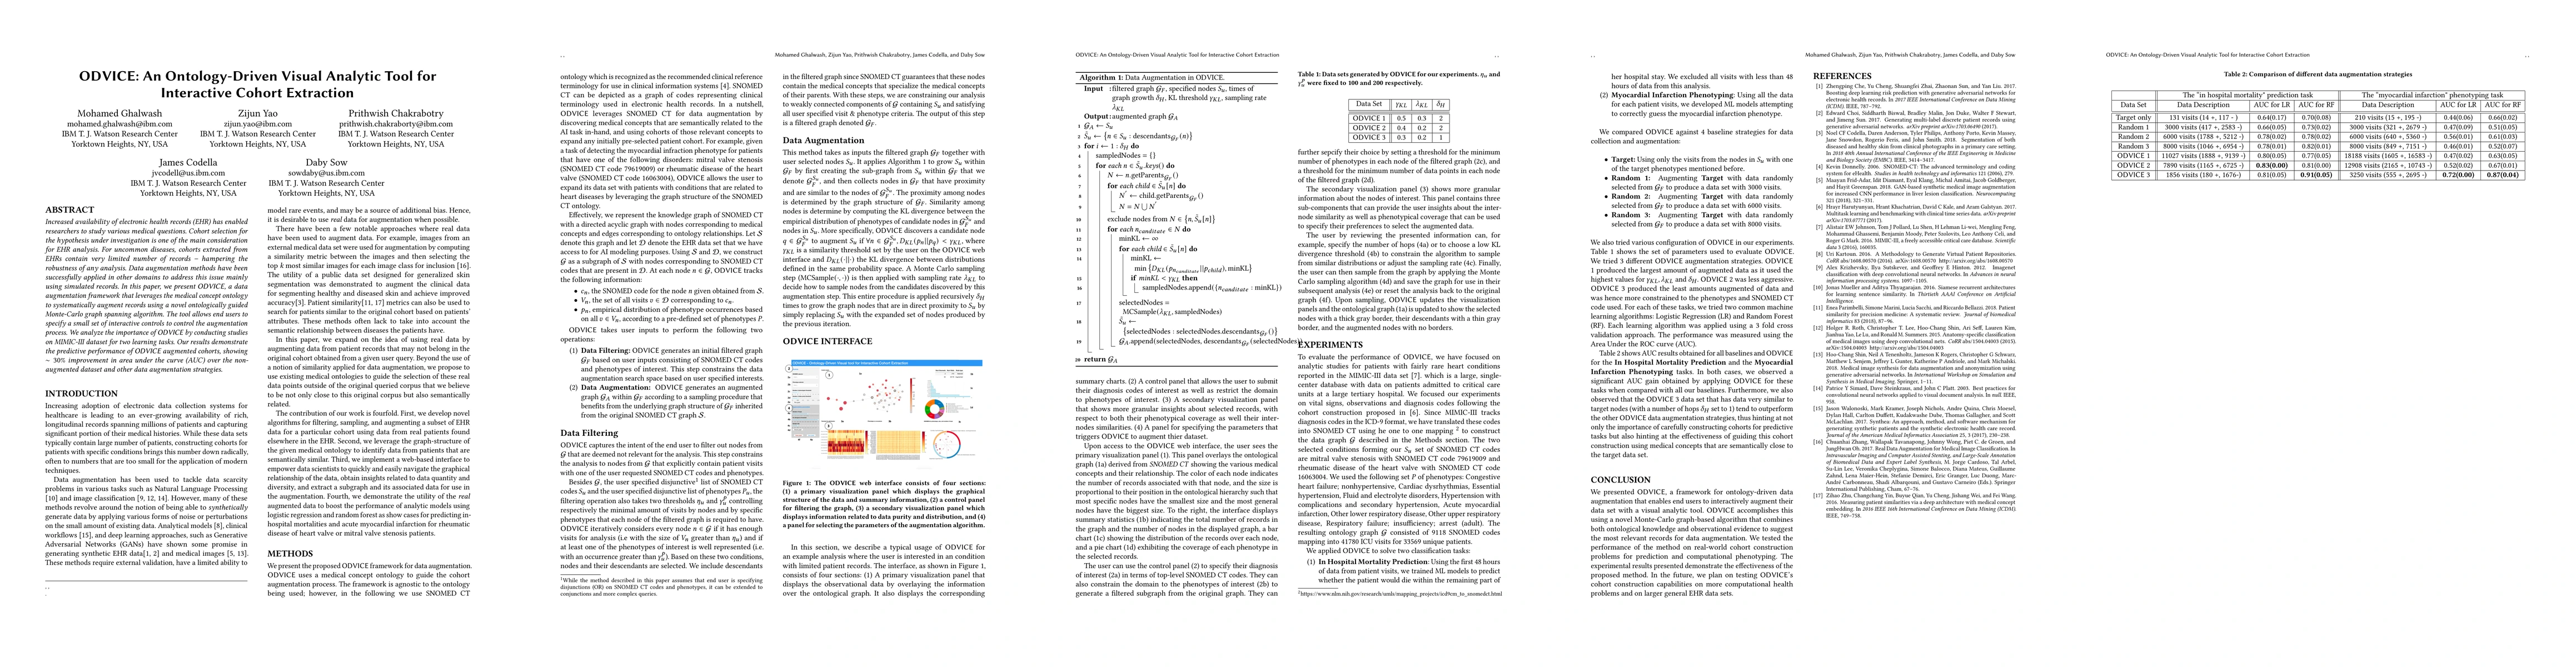
Increased availability of electronic health records (EHR) has enabled researchers to study various medical questions. Cohort selection for the hypothesis under investigation is one of the main consideration for EHR analysis. For uncommon diseases, cohorts extracted from EHRs contain very limited number of records - hampering the robustness of any analysis. Data augmentation methods have been successfully applied in other domains to address this issue mainly using simulated records. In this paper, we present ODVICE, a data augmentation framework that leverages the medical concept ontology to systematically augment records using a novel ontologically guided Monte-Carlo graph spanning algorithm. The tool allows end users to specify a small set of interactive controls to control the augmentation process. We analyze the importance of ODVICE by conducting studies on MIMIC-III dataset for two learning tasks. Our results demonstrate the predictive performance of ODVICE augmented cohorts, showing ~30% improvement in area under the curve (AUC) over the non-augmented dataset and other data augmentation strategies.
AI Key Findings
Get AI-generated insights about this paper's methodology, results, significance, and more — seven facets brought into focus.
Impact
Paper Details
Authors
PDF Preview
Key Terms
Citation Network
Current paper (gray), citations (green), references (blue)
Display is limited for performance on very large graphs.
Discussion 0